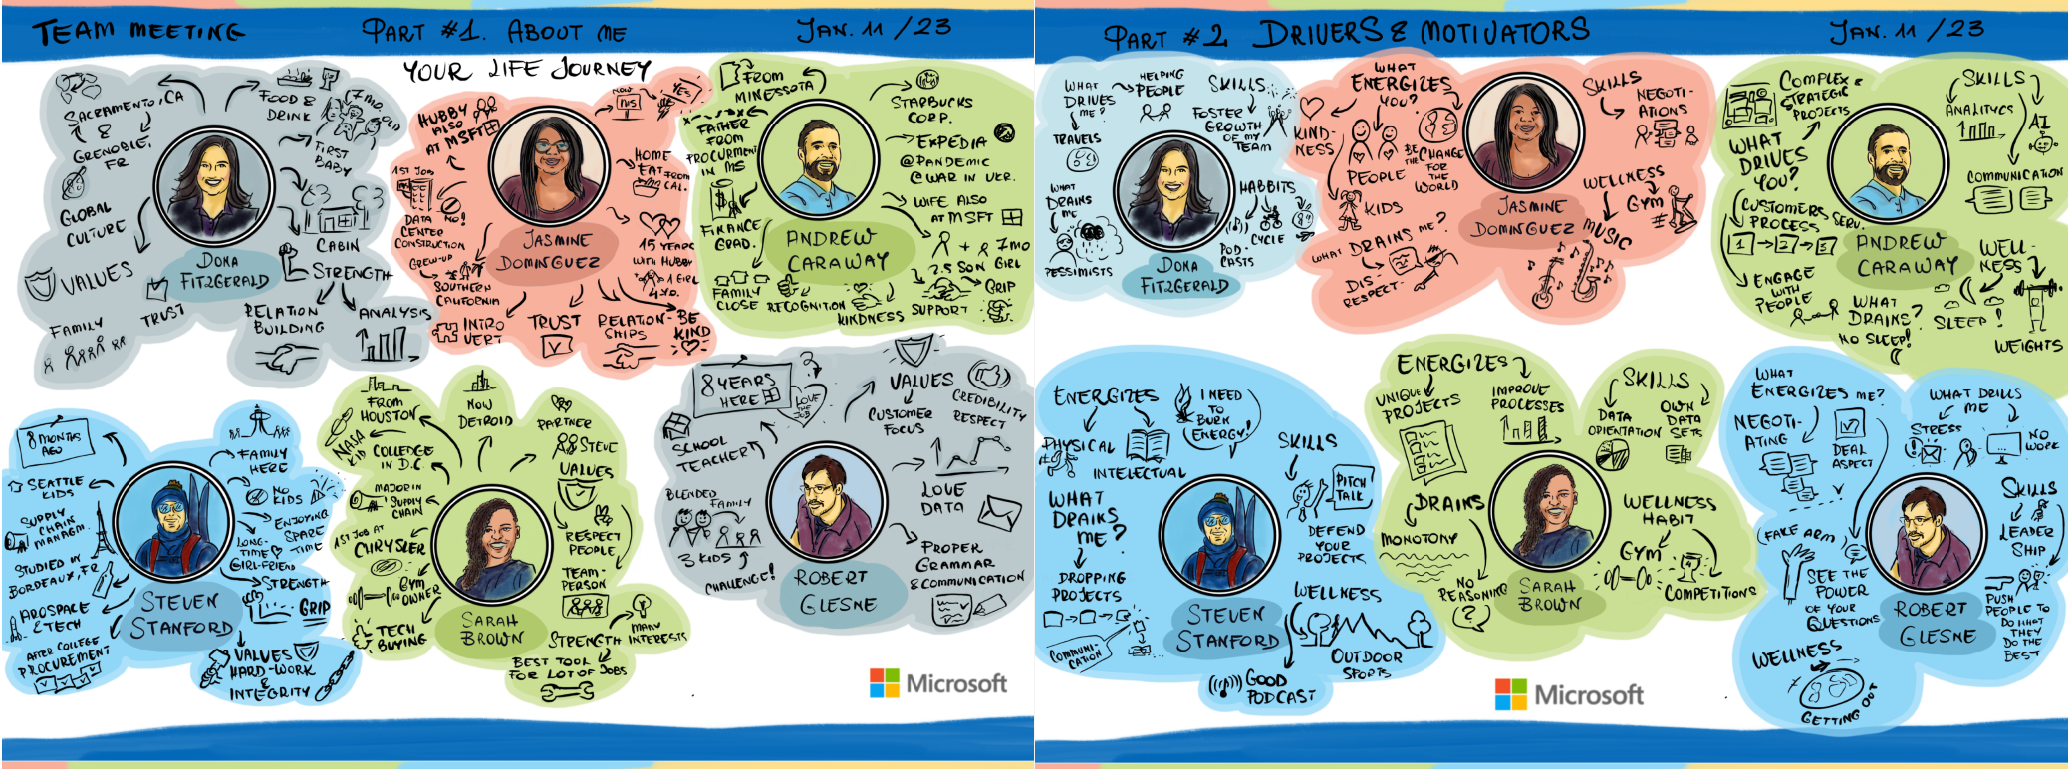
How do you create a visual summary of a conference where the conversation moves from geopolitics and security through artificial intelligence, business transformation and leadership to the labour market and the future of cities?
This was the challenge I faced during ABSL Summit 2026, held on 17–19 June 2026 at Centennial Hall in Wrocław.
As Basia Rysuje, I created a series of digital visual notes – graphic recordings – throughout the event, capturing and organising the key ideas from each session. The result was not only a visual record of the conference, but a whole set of materials that could be used in further communication.
It is a good example of how visual communication at a conference can help participants understand complex topics while giving organisers a way to preserve and continue using the event’s most important ideas.
What are visual notes from a conference?
Visual notes, also known as graphic recording, are a visual summary of the most important ideas that emerge during a presentation, debate or panel discussion.
The aim is not to draw everything that has been said.
A graphic recorder listens to the session, selects the key ideas, shows the relationships between them and organises the information into a clear structure. Text, simple illustrations, symbols, colours and information hierarchy come together on a single board, making it possible to quickly see what the conversation was really about.
At large conferences, this format becomes part of a broader visual communication system for the entire event.
ABSL Summit 2026 – many topics, one shared challenge
The ABSL Summit programme included debates, conversations and presentations covering a wide range of topics.
These included crisis scenarios and organisational resilience, AI and automation, transformation of the business services sector, leadership, demographics, the talent market and urban development.
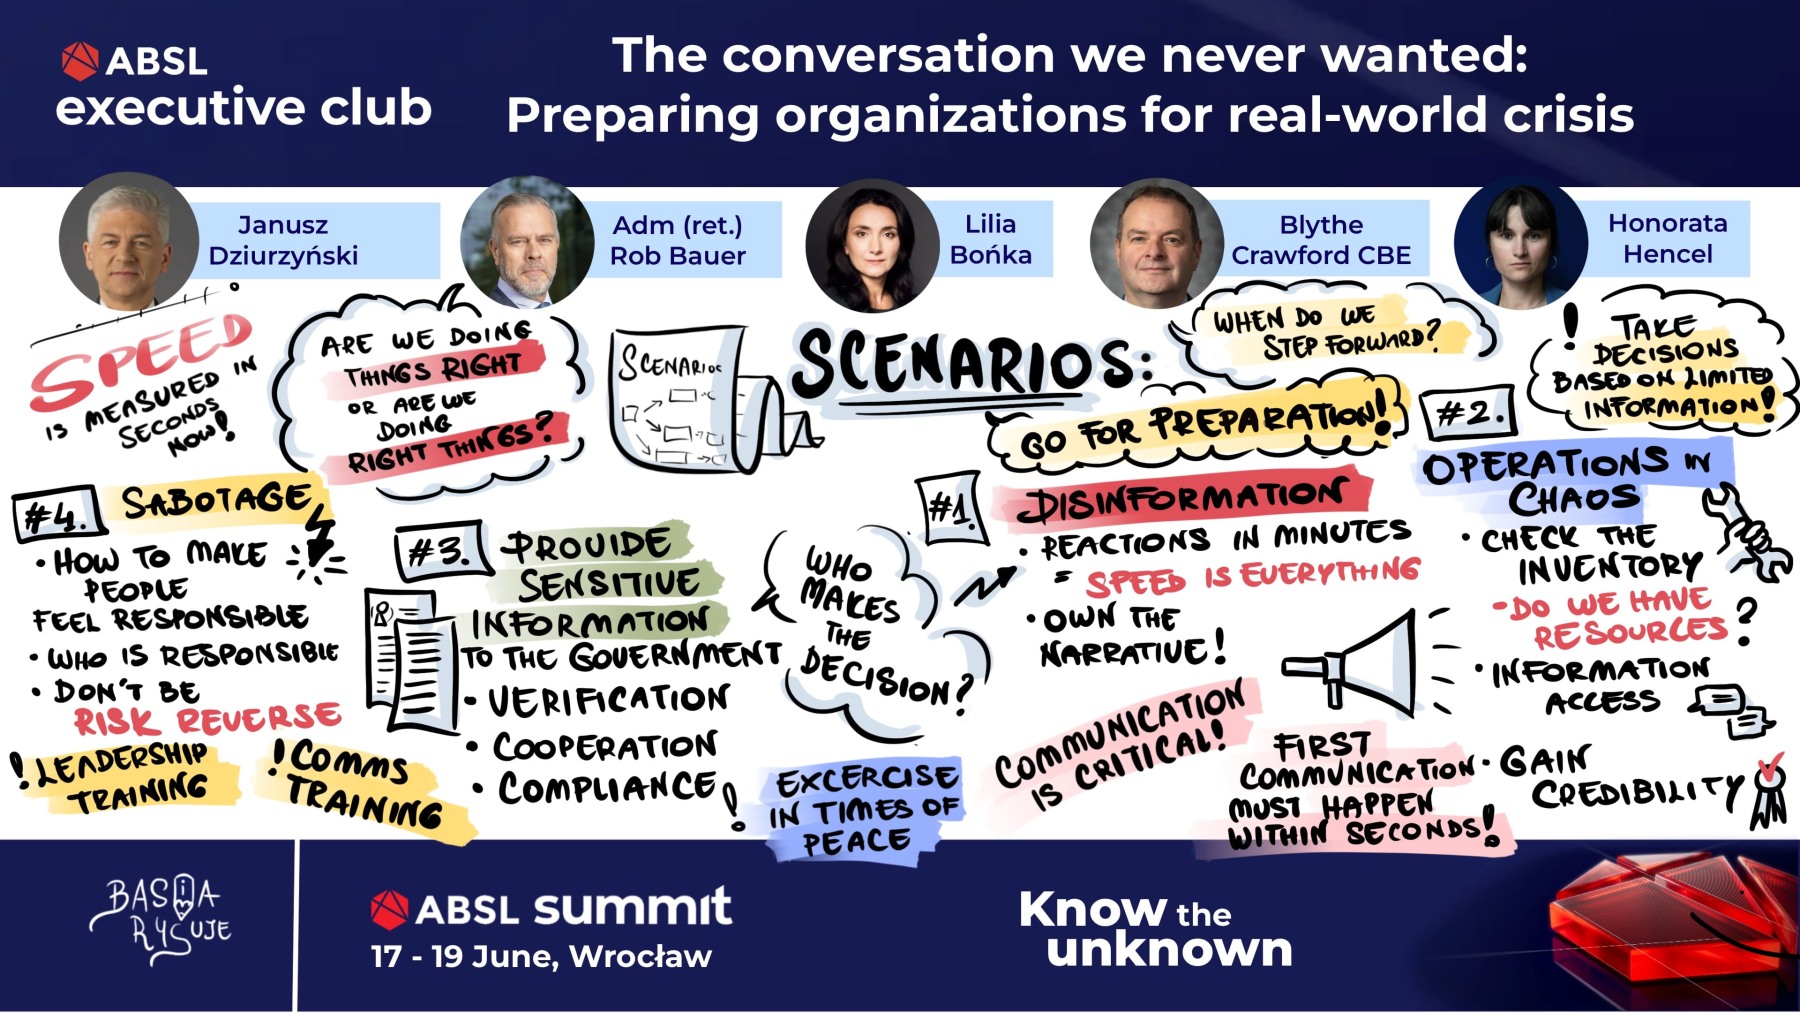
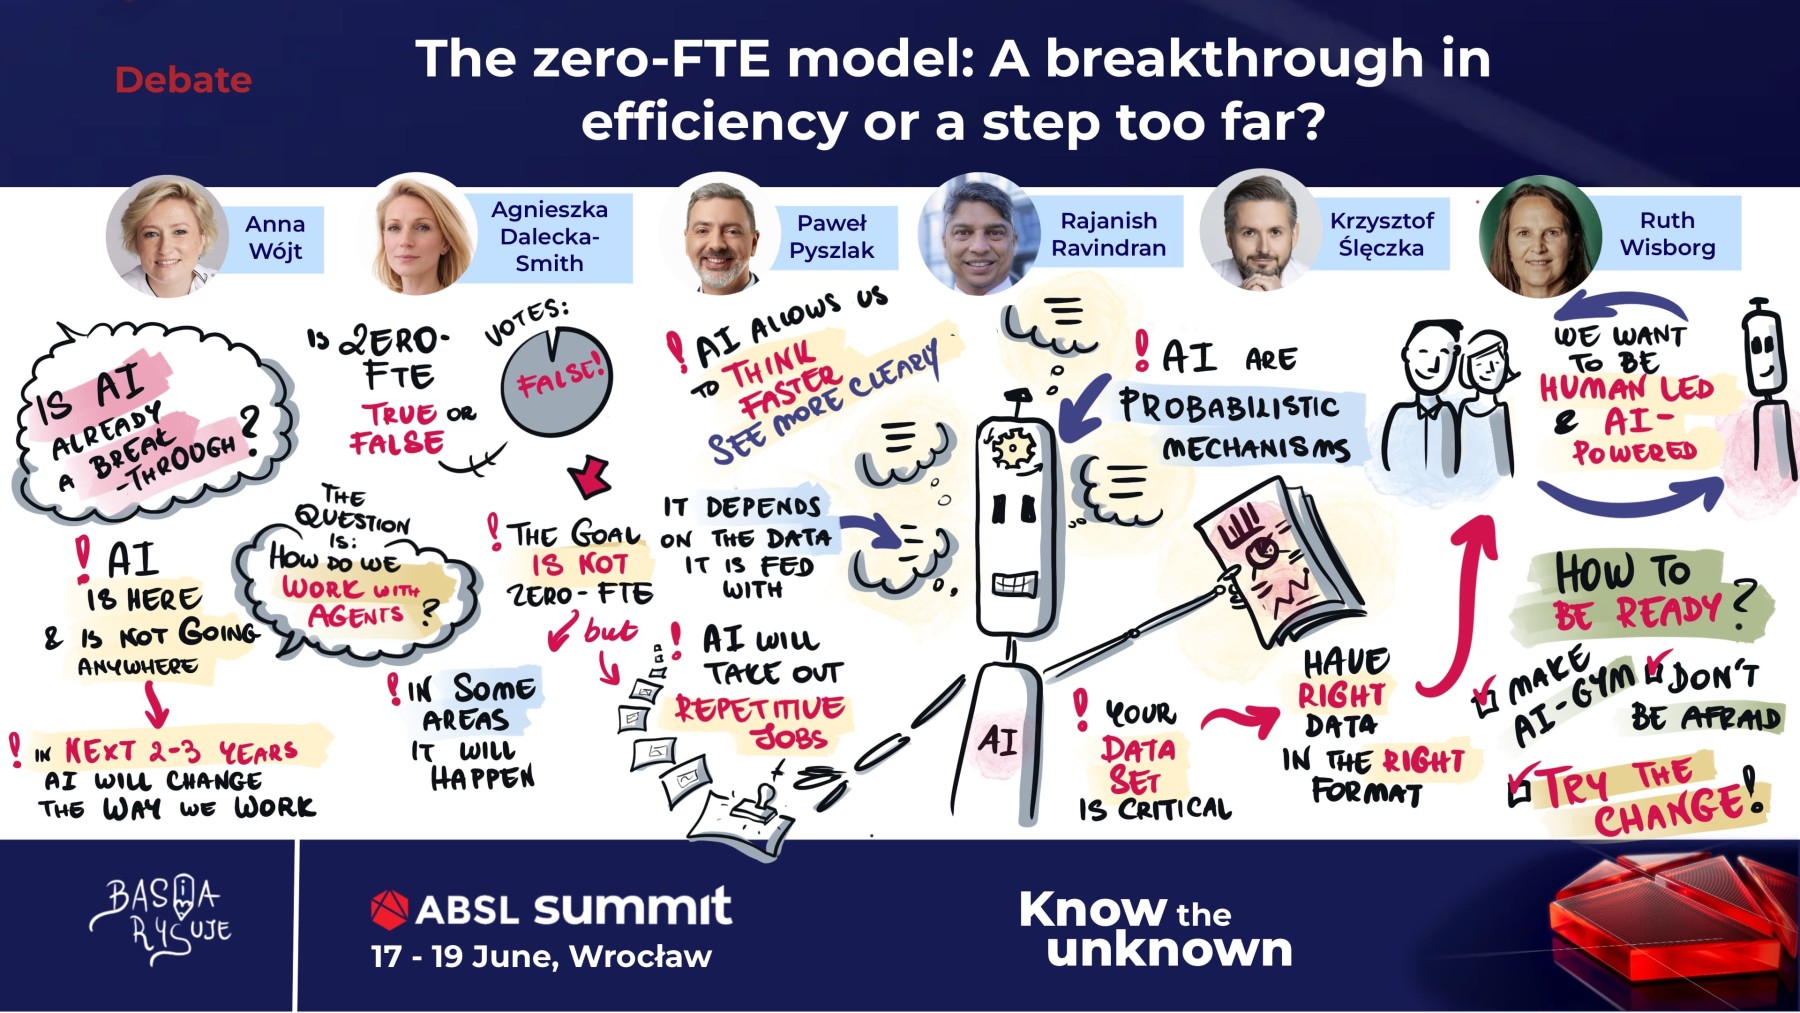
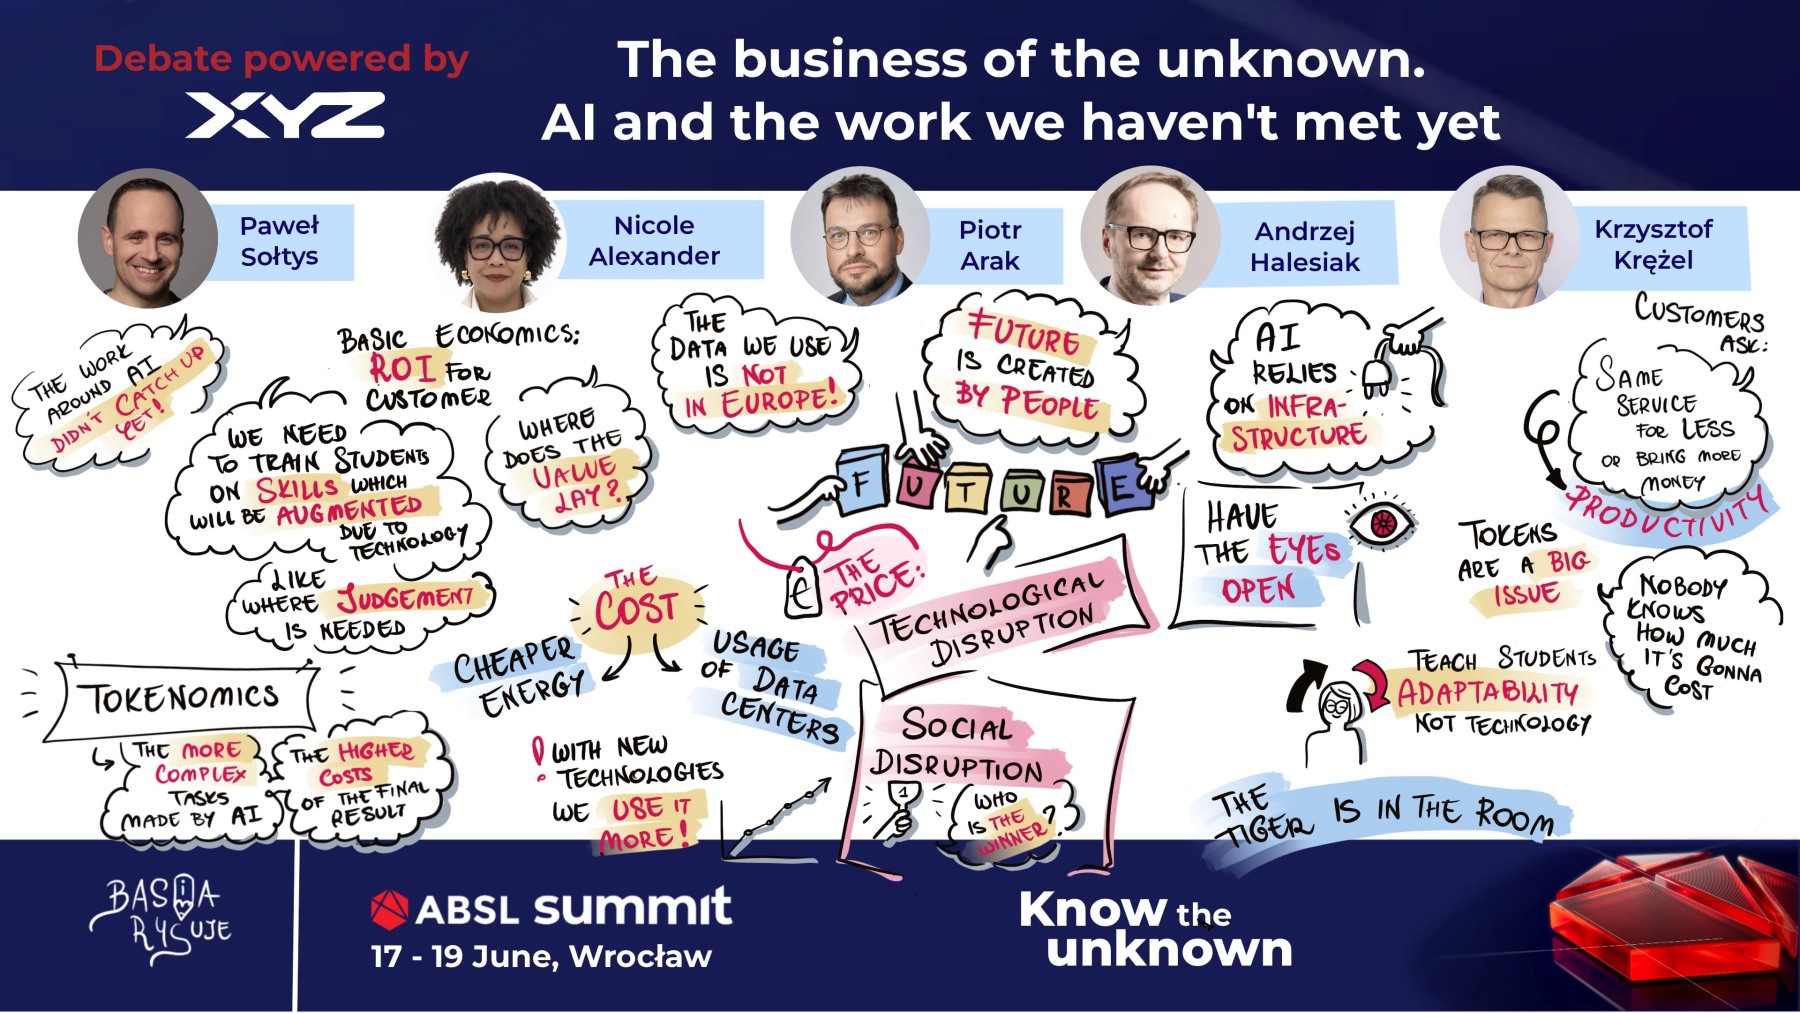
One debate focused on preparing organisations for real-life crisis situations. Another explored the zero-FTE model and the role of humans in companies making increasingly extensive use of AI.
There were also conversations about the future of offices and their impact on cities, changes in the talent market, leadership, Poland’s position and the further development of the business services sector.
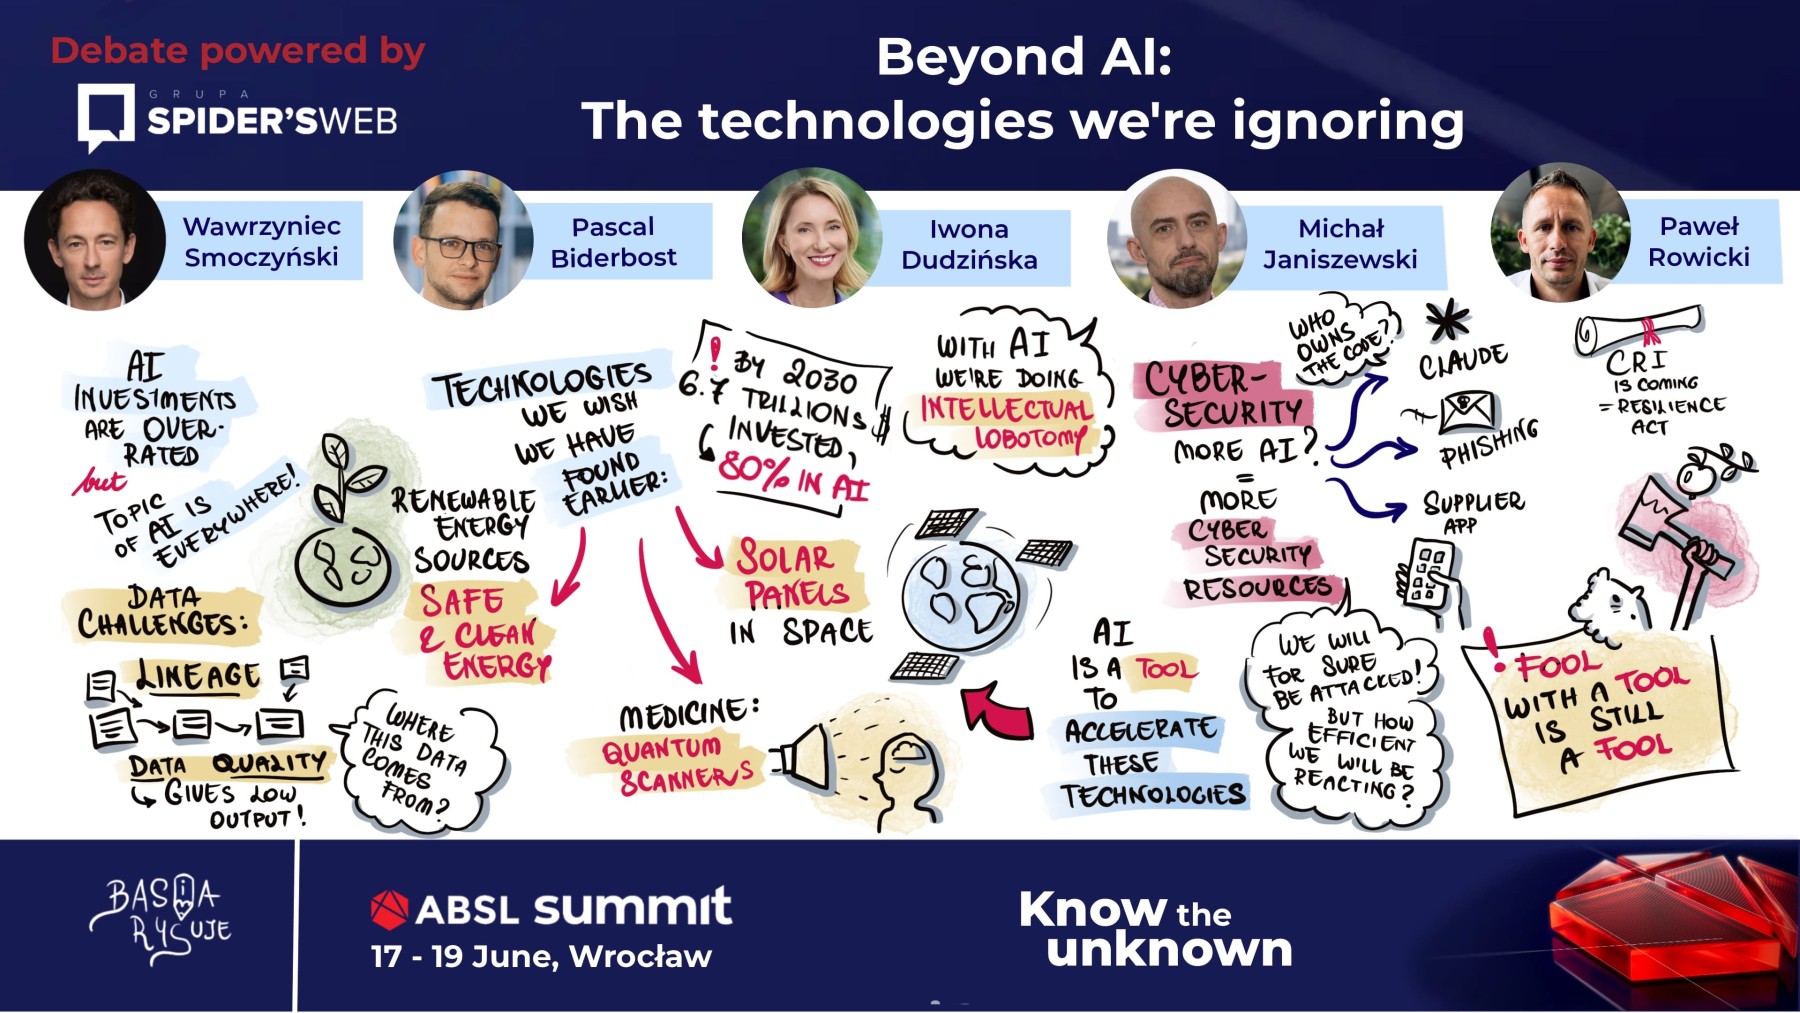
The programme also covered technologies beyond artificial intelligence, including cybersecurity, quantum solutions and data-related issues.
The topics varied, but many of the conversations led back to a similar question: how do we make decisions and develop organisations in a reality that is becoming increasingly difficult to predict?
How do you create graphic recordings from such a complex conference?
At an event covering so many different subjects, the biggest challenge is not a lack of content. It is having too much of it.
Several people may speak during a single panel. There are statistics, examples, arguments and different points of view. Not everything can – or should – make it onto the board.
That is why creating a visual note begins with listening, selecting and synthesising information.
You need to identify:
- the main idea of the conversation,
- the arguments that develop it,
- important data and examples,
- contrasts between different positions,
- shared conclusions,
- questions that remain open.
Only then does the drawing begin.
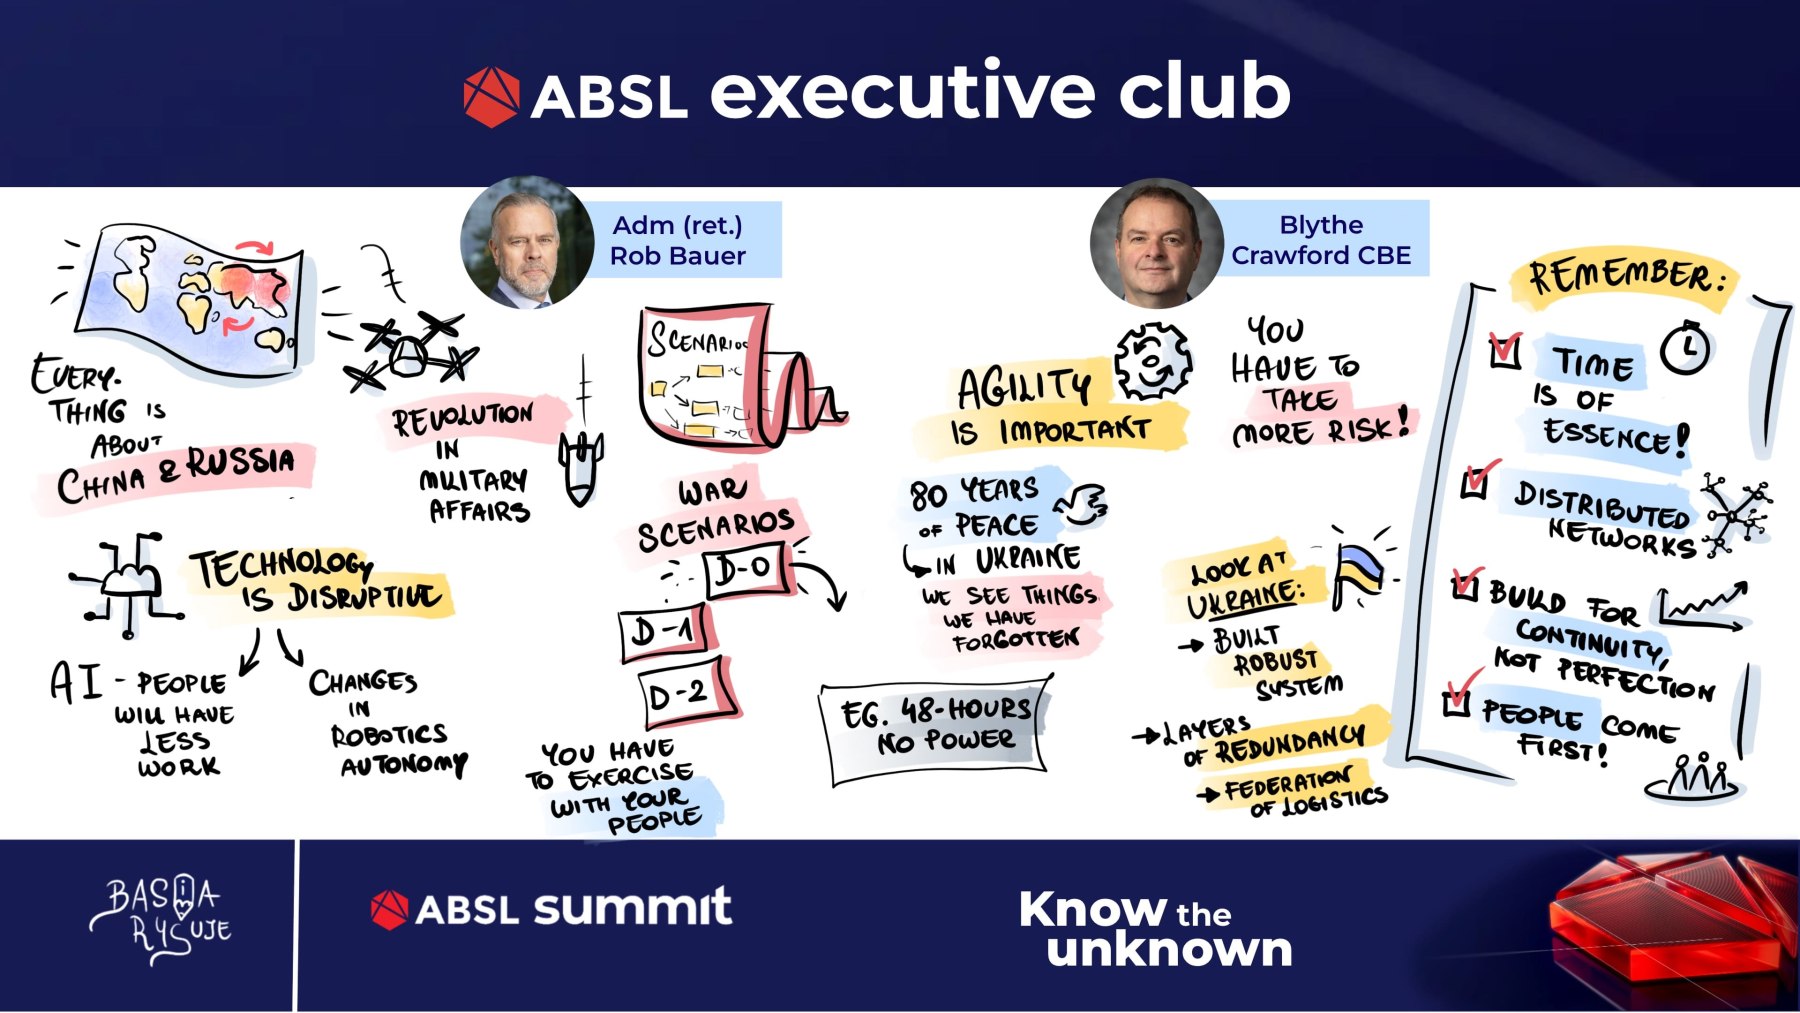
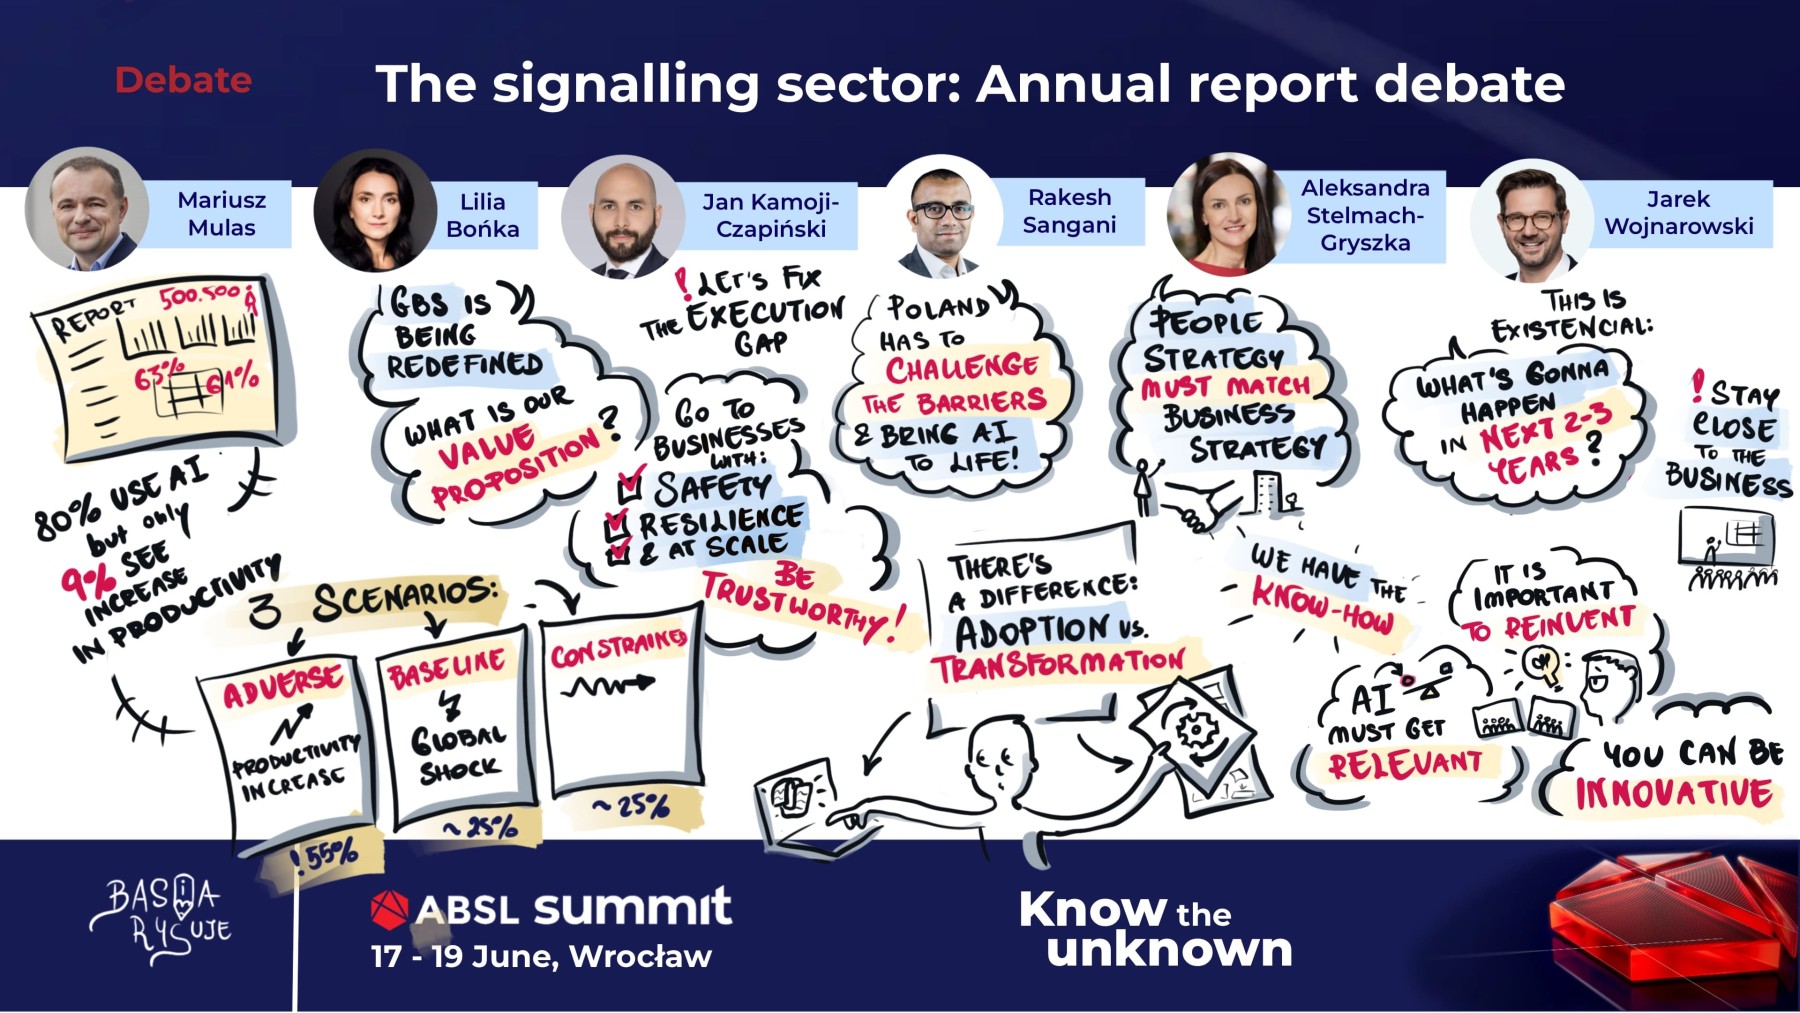
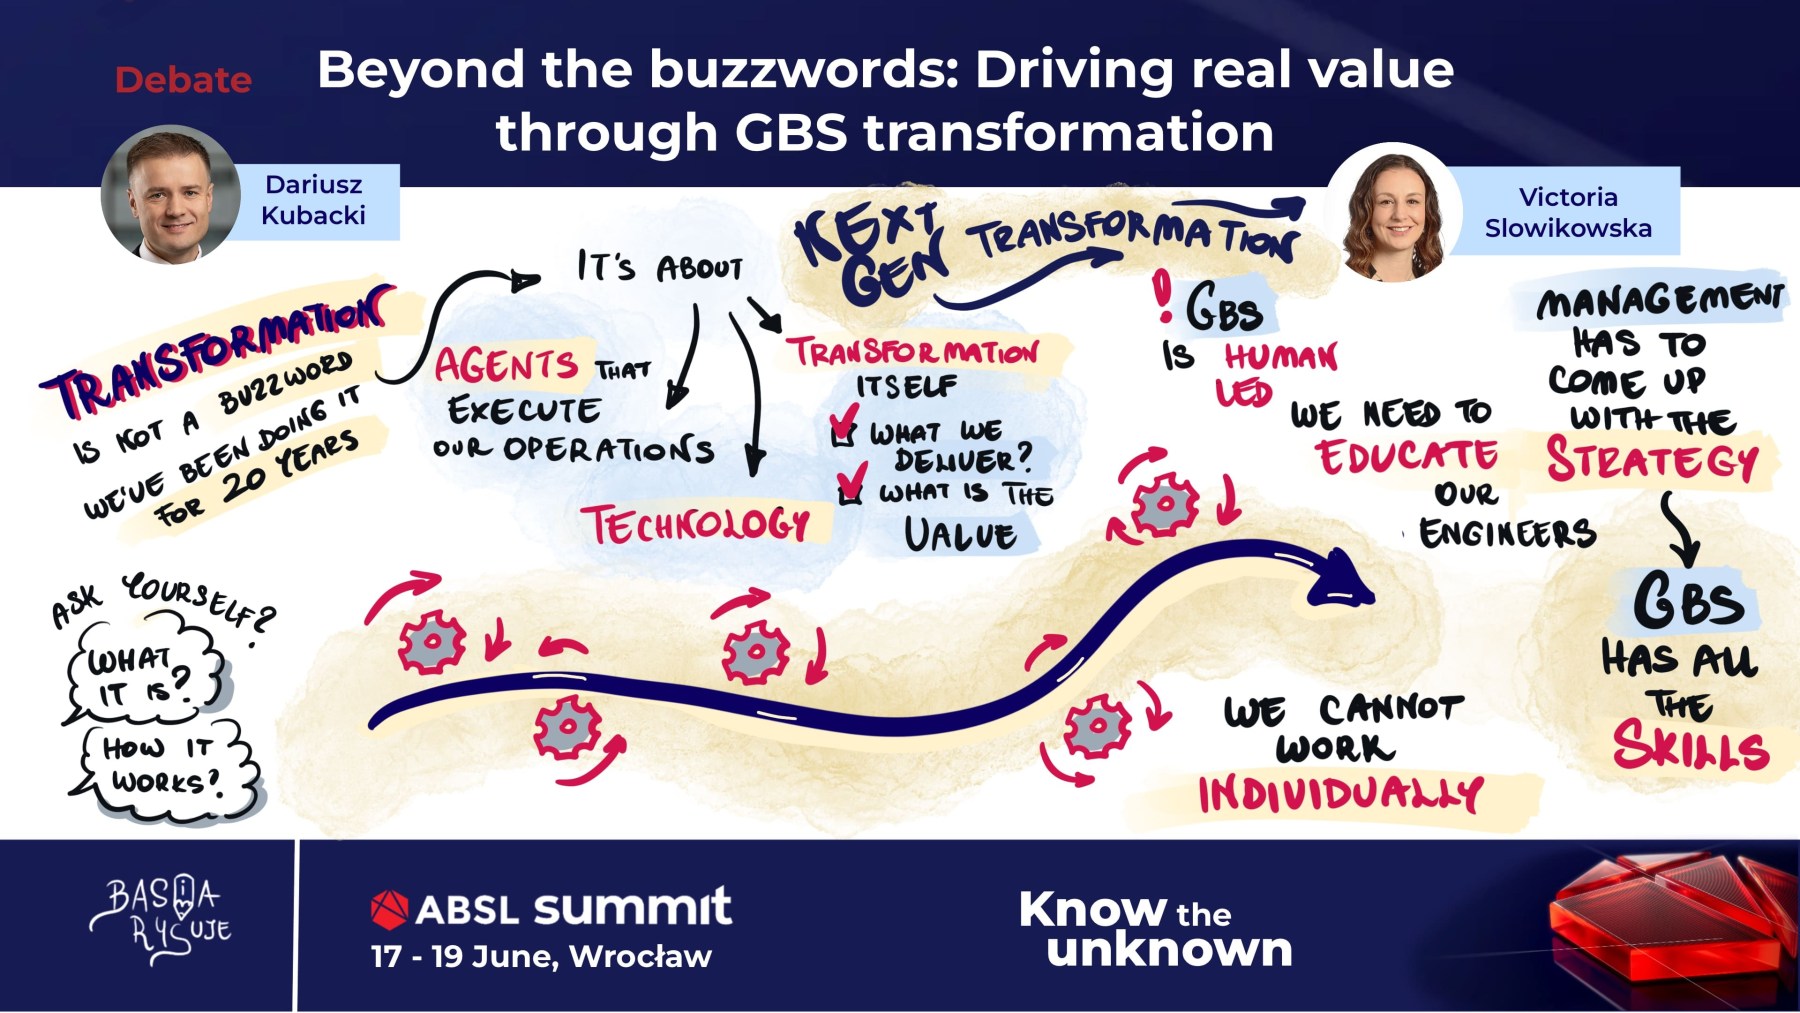
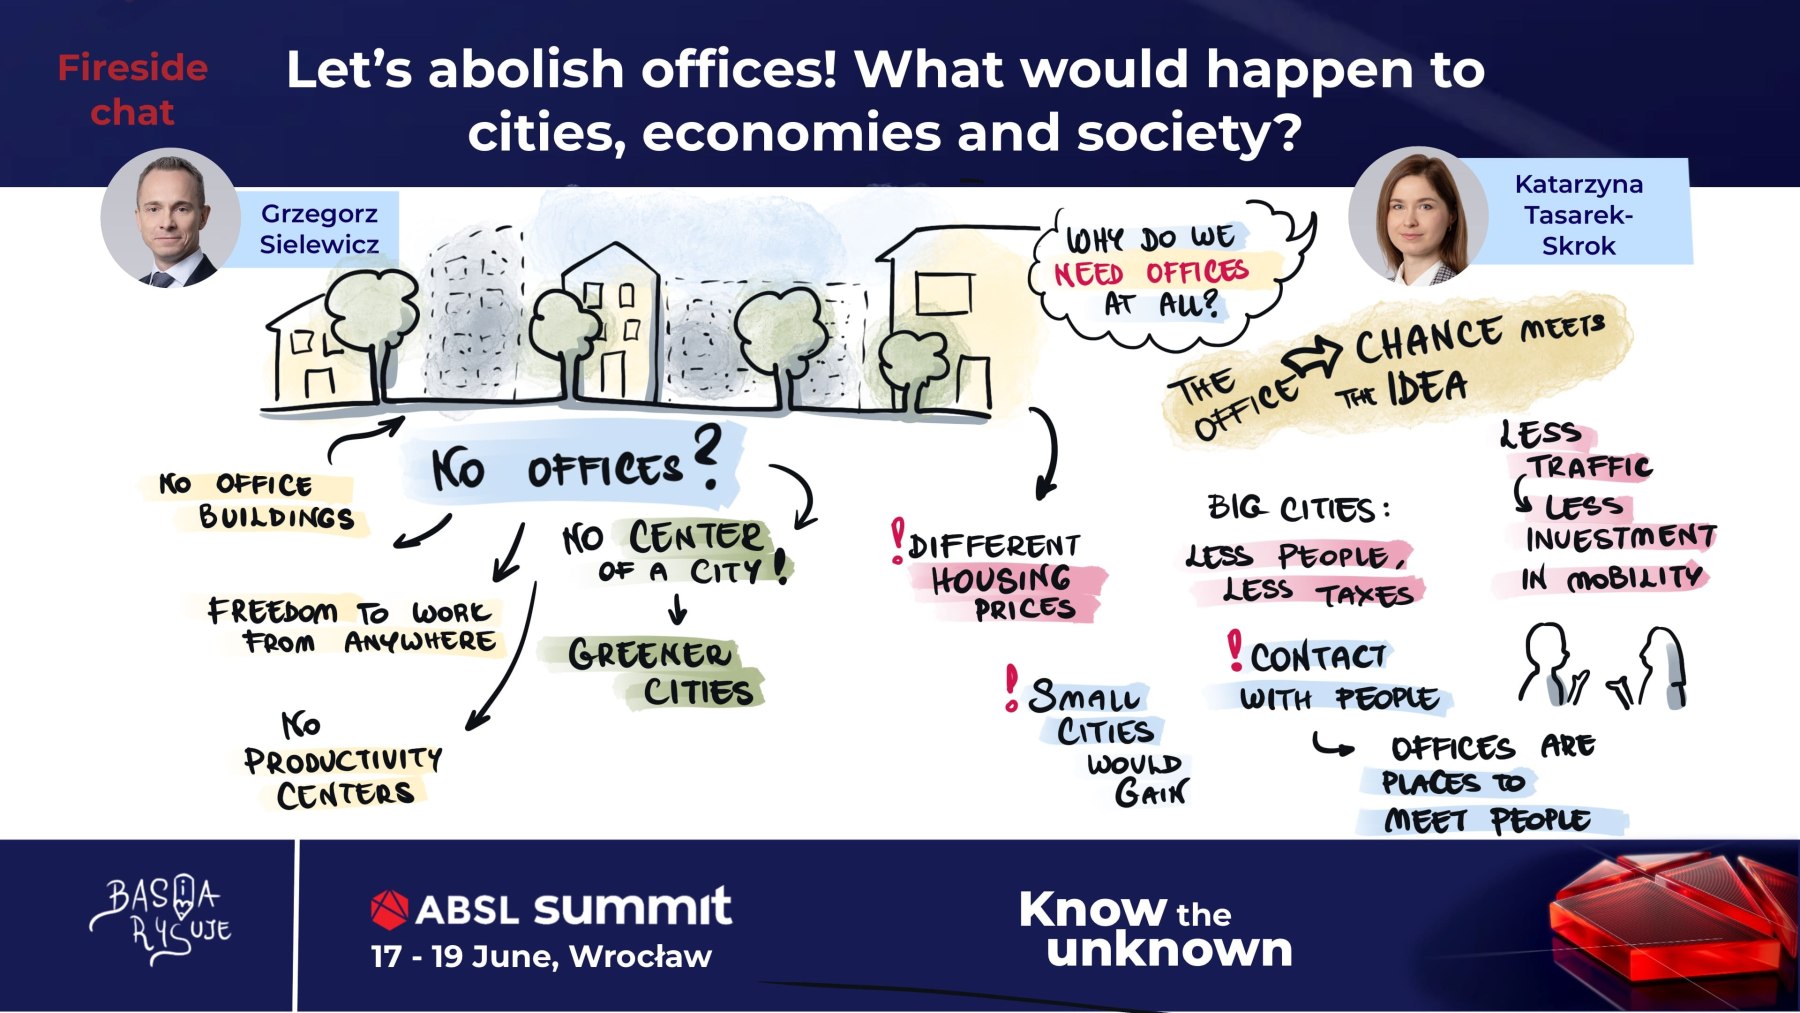
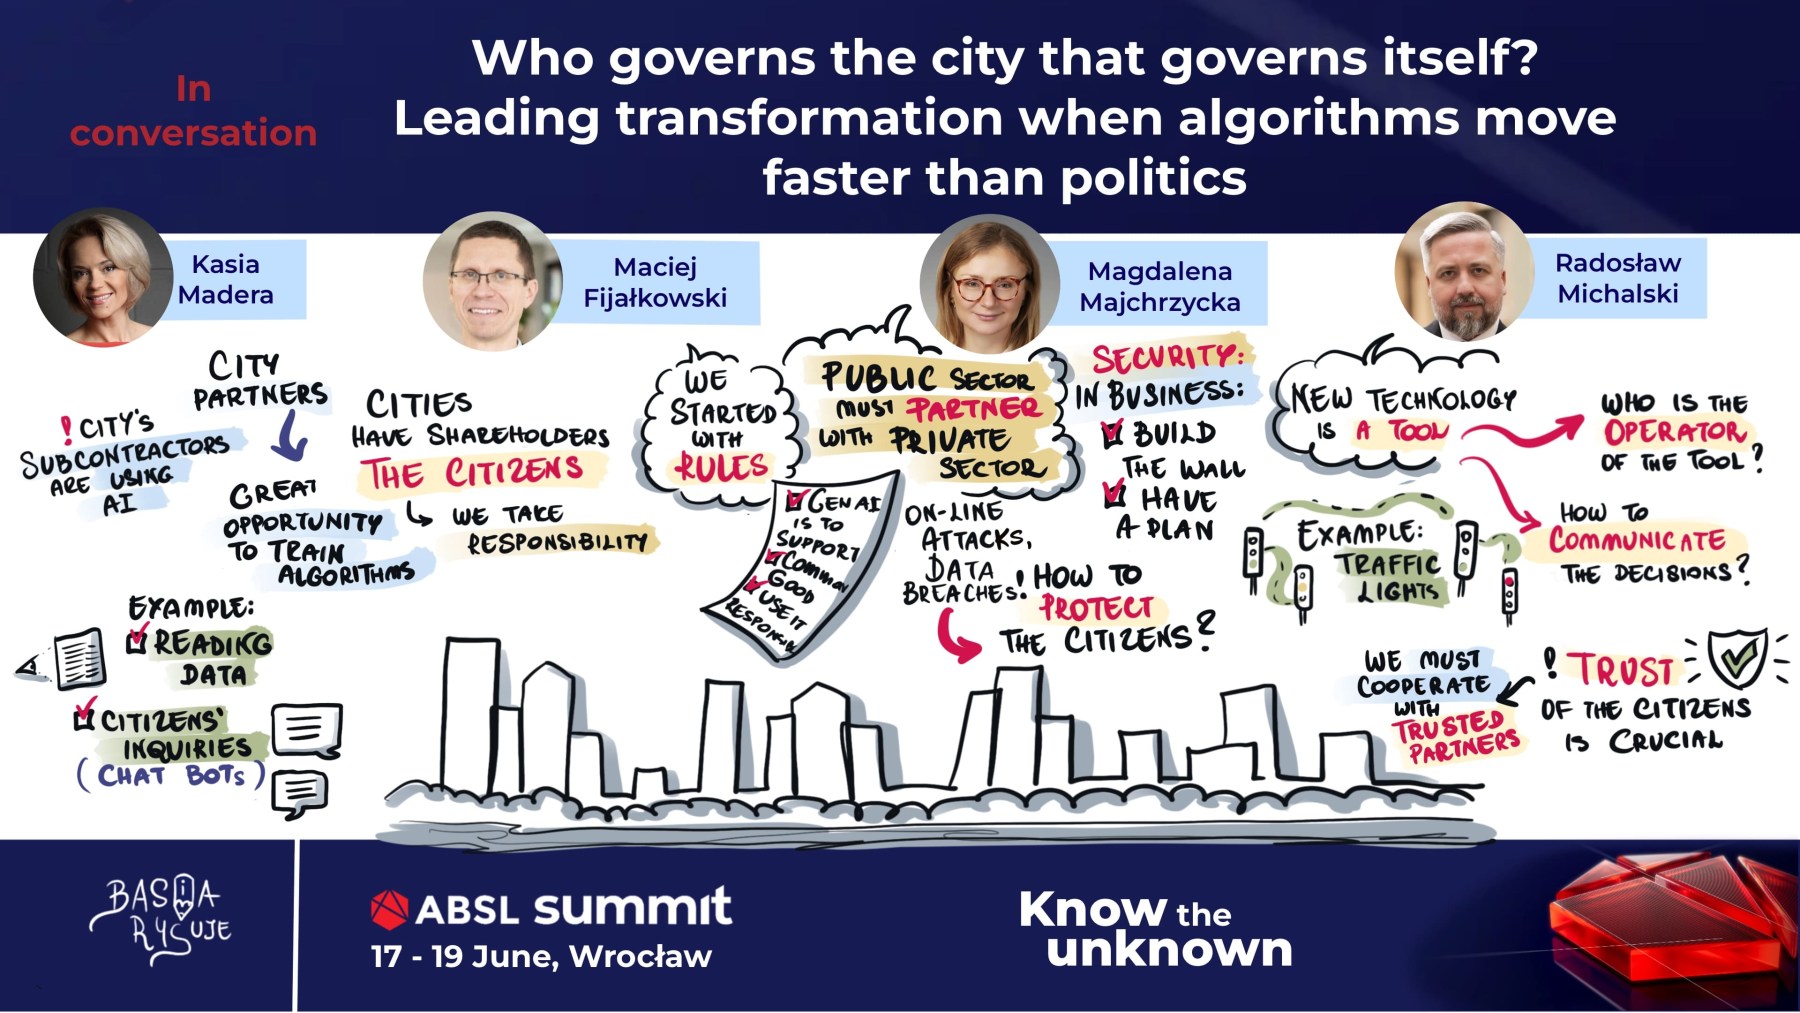
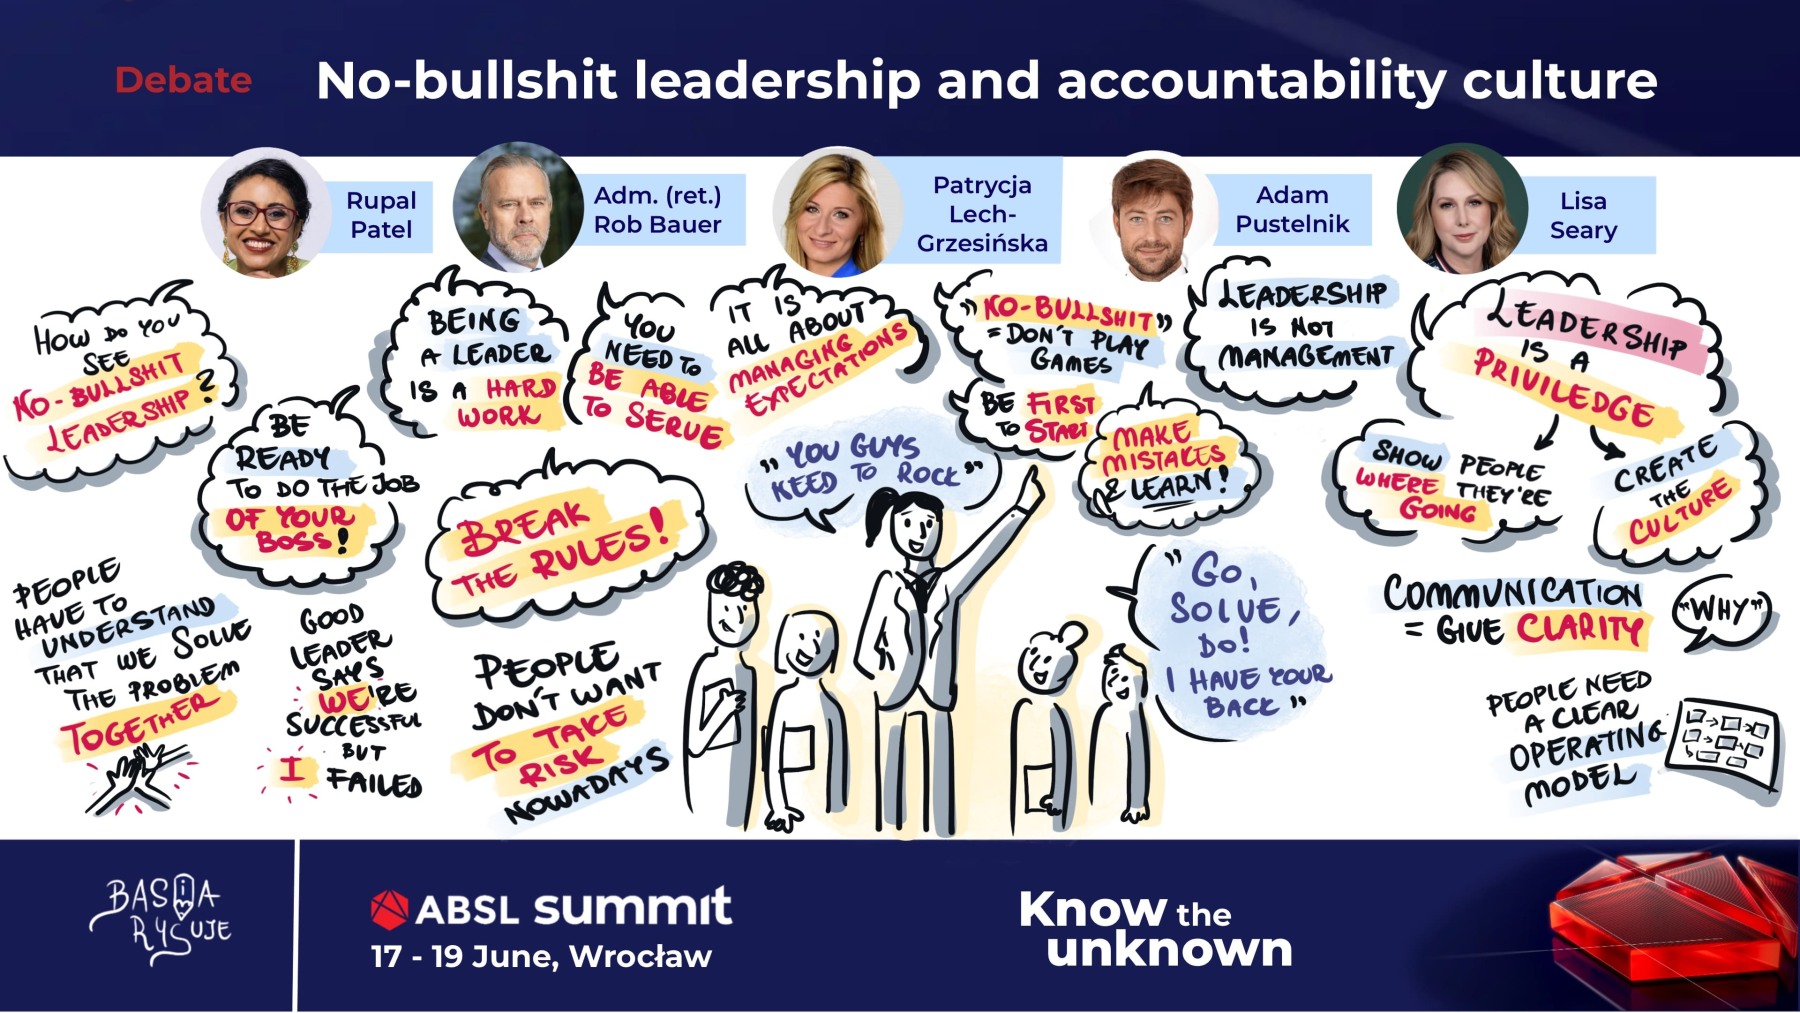
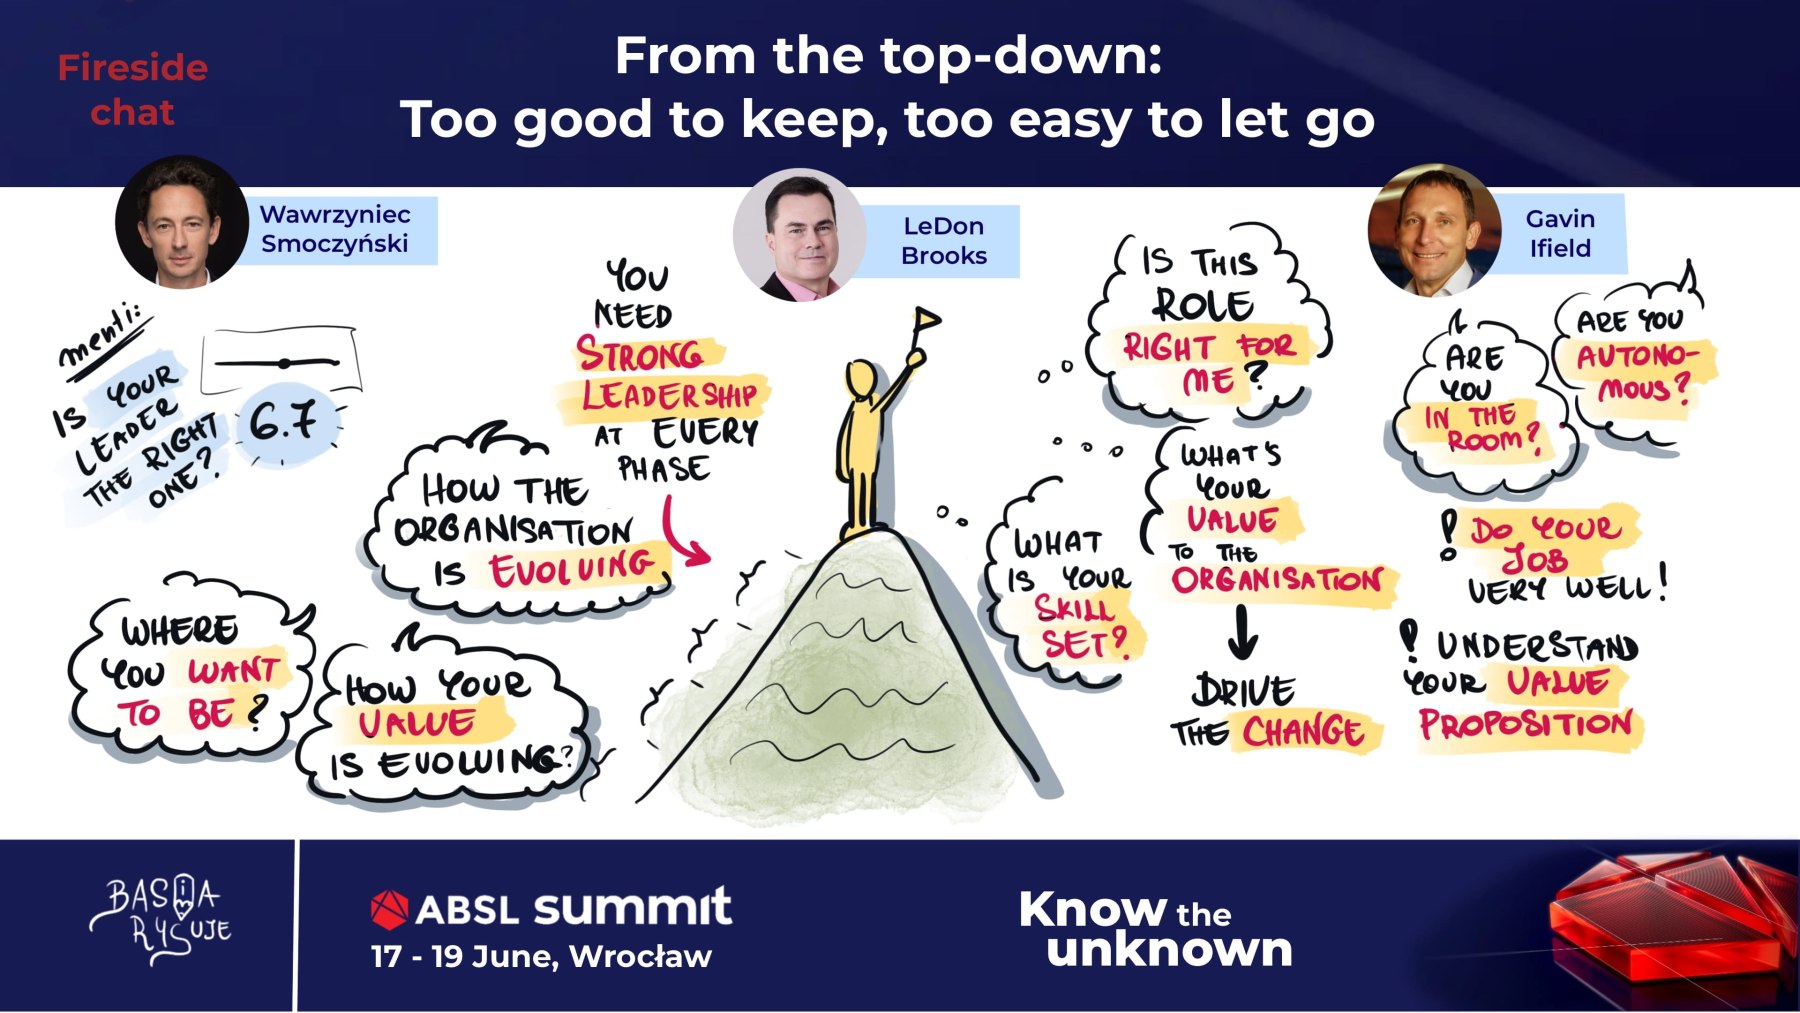
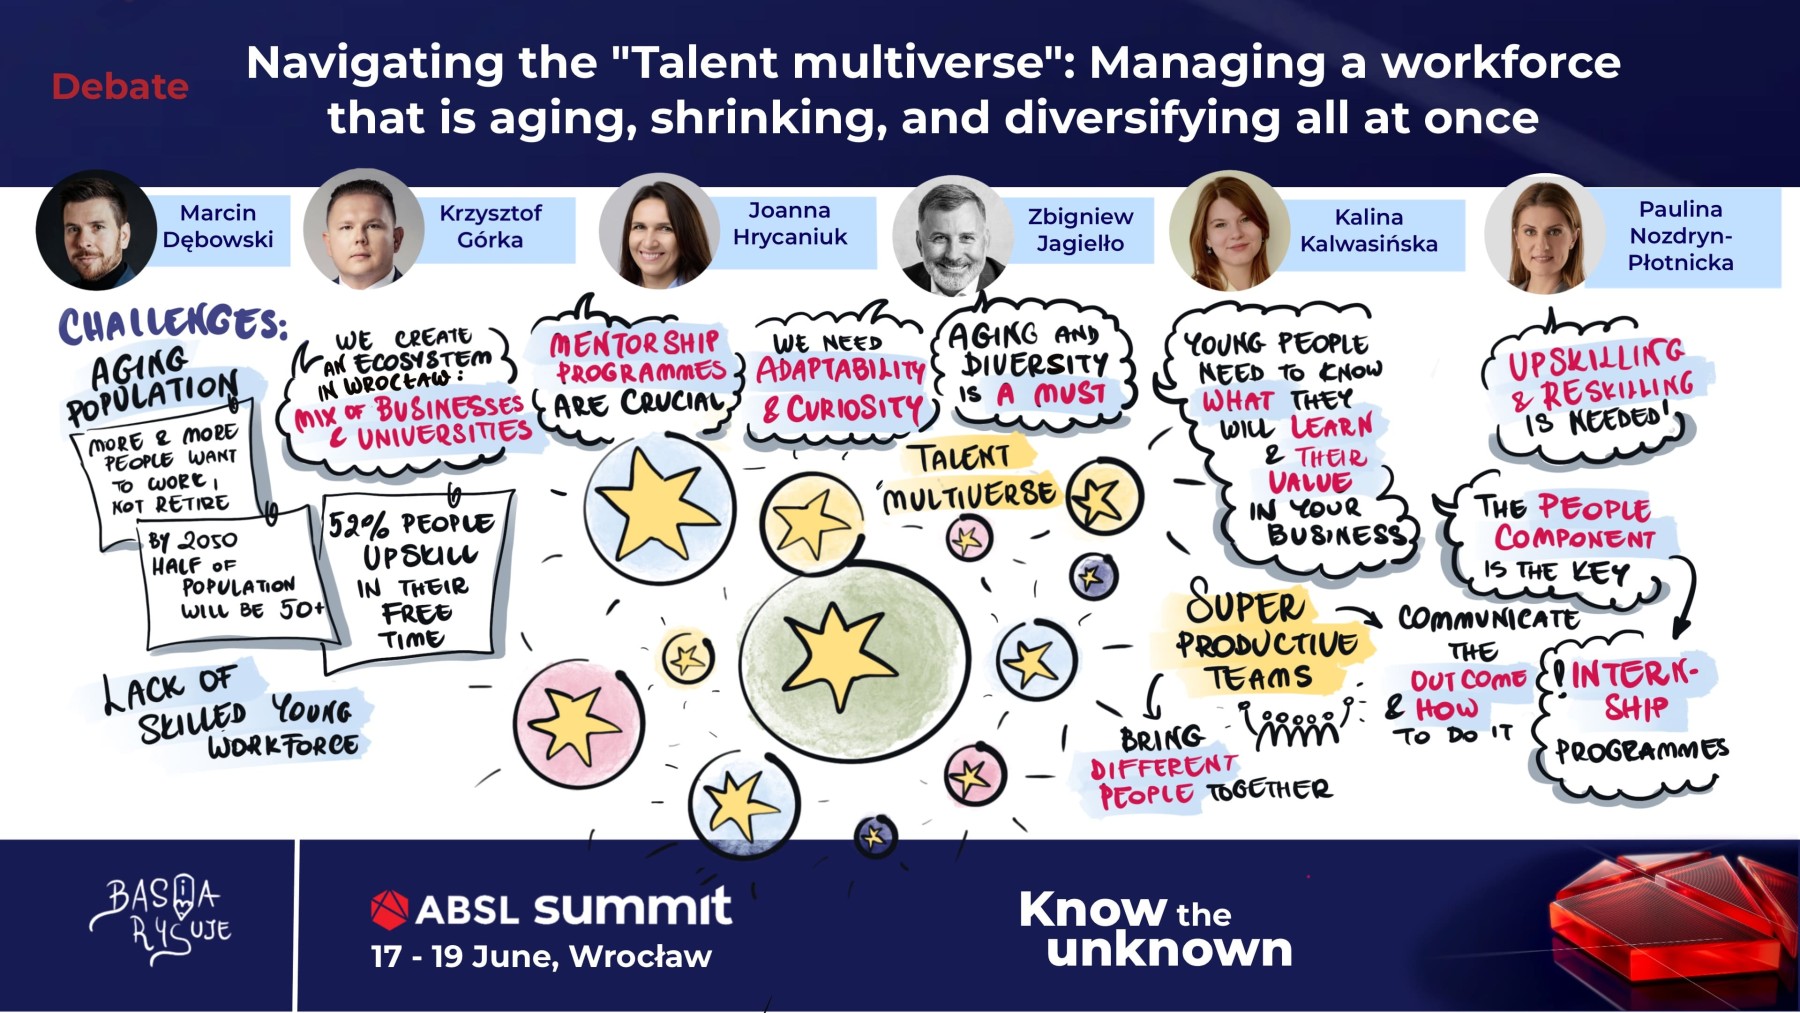
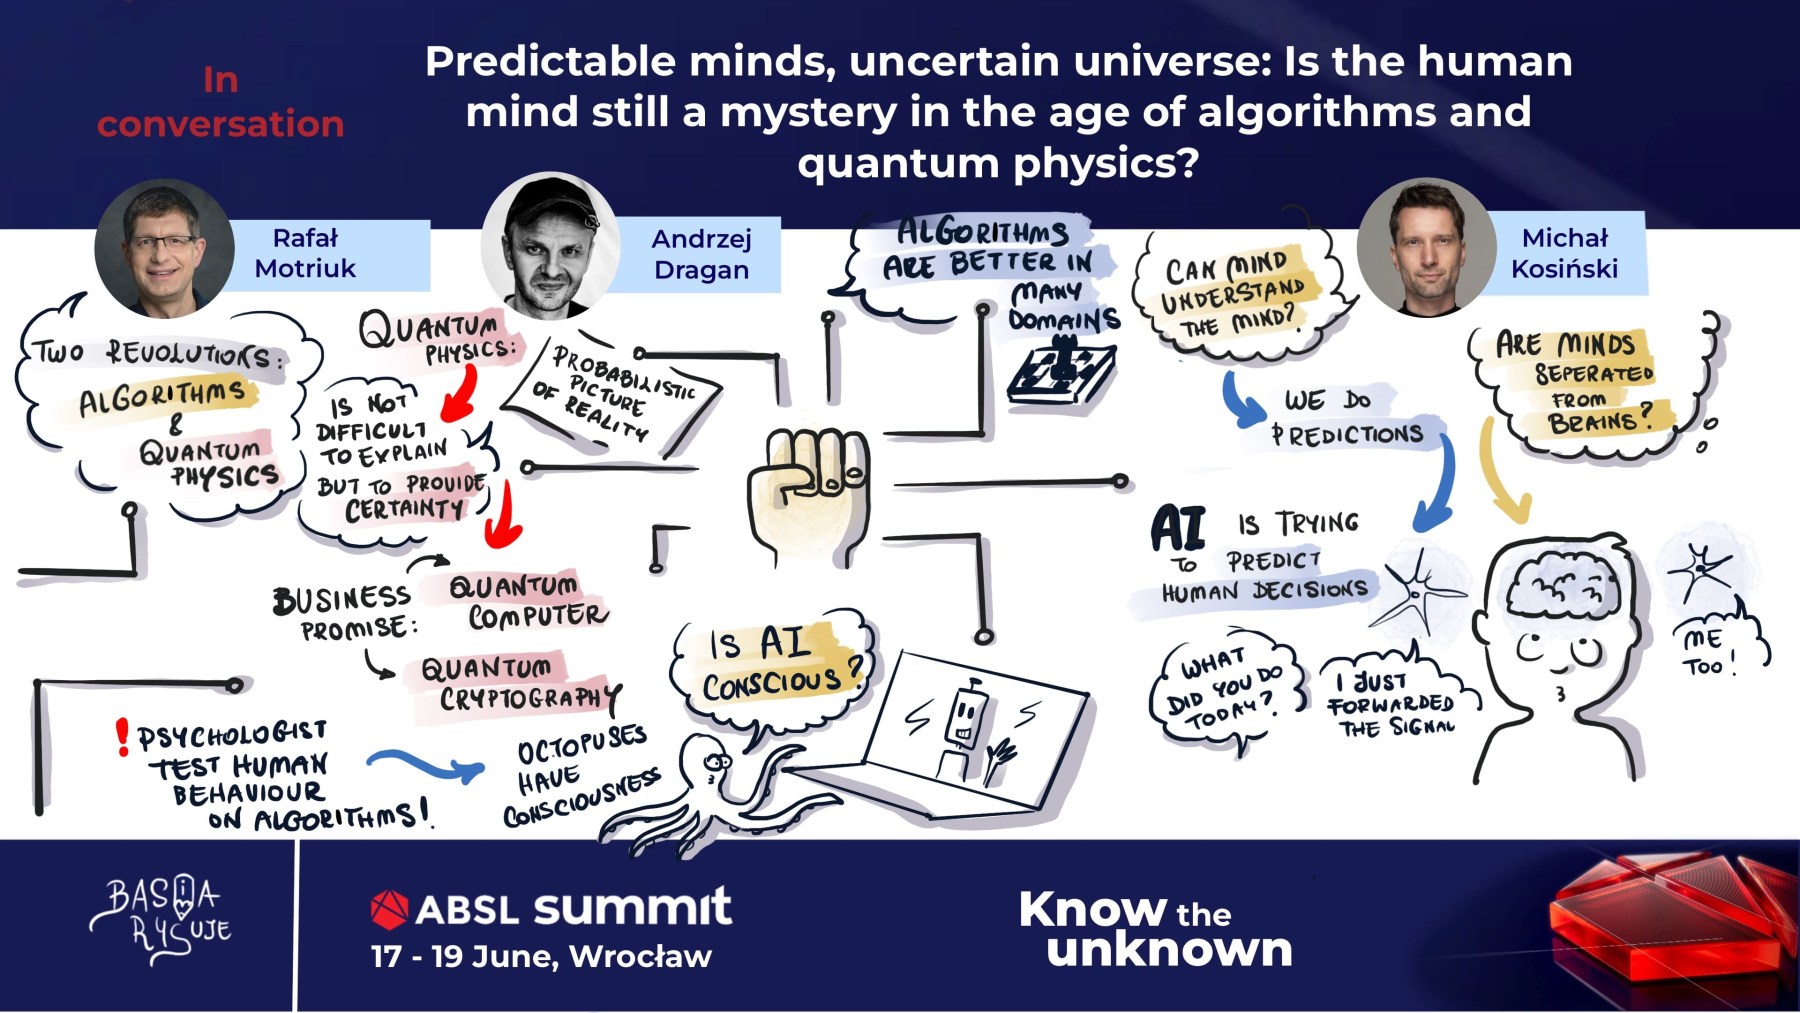
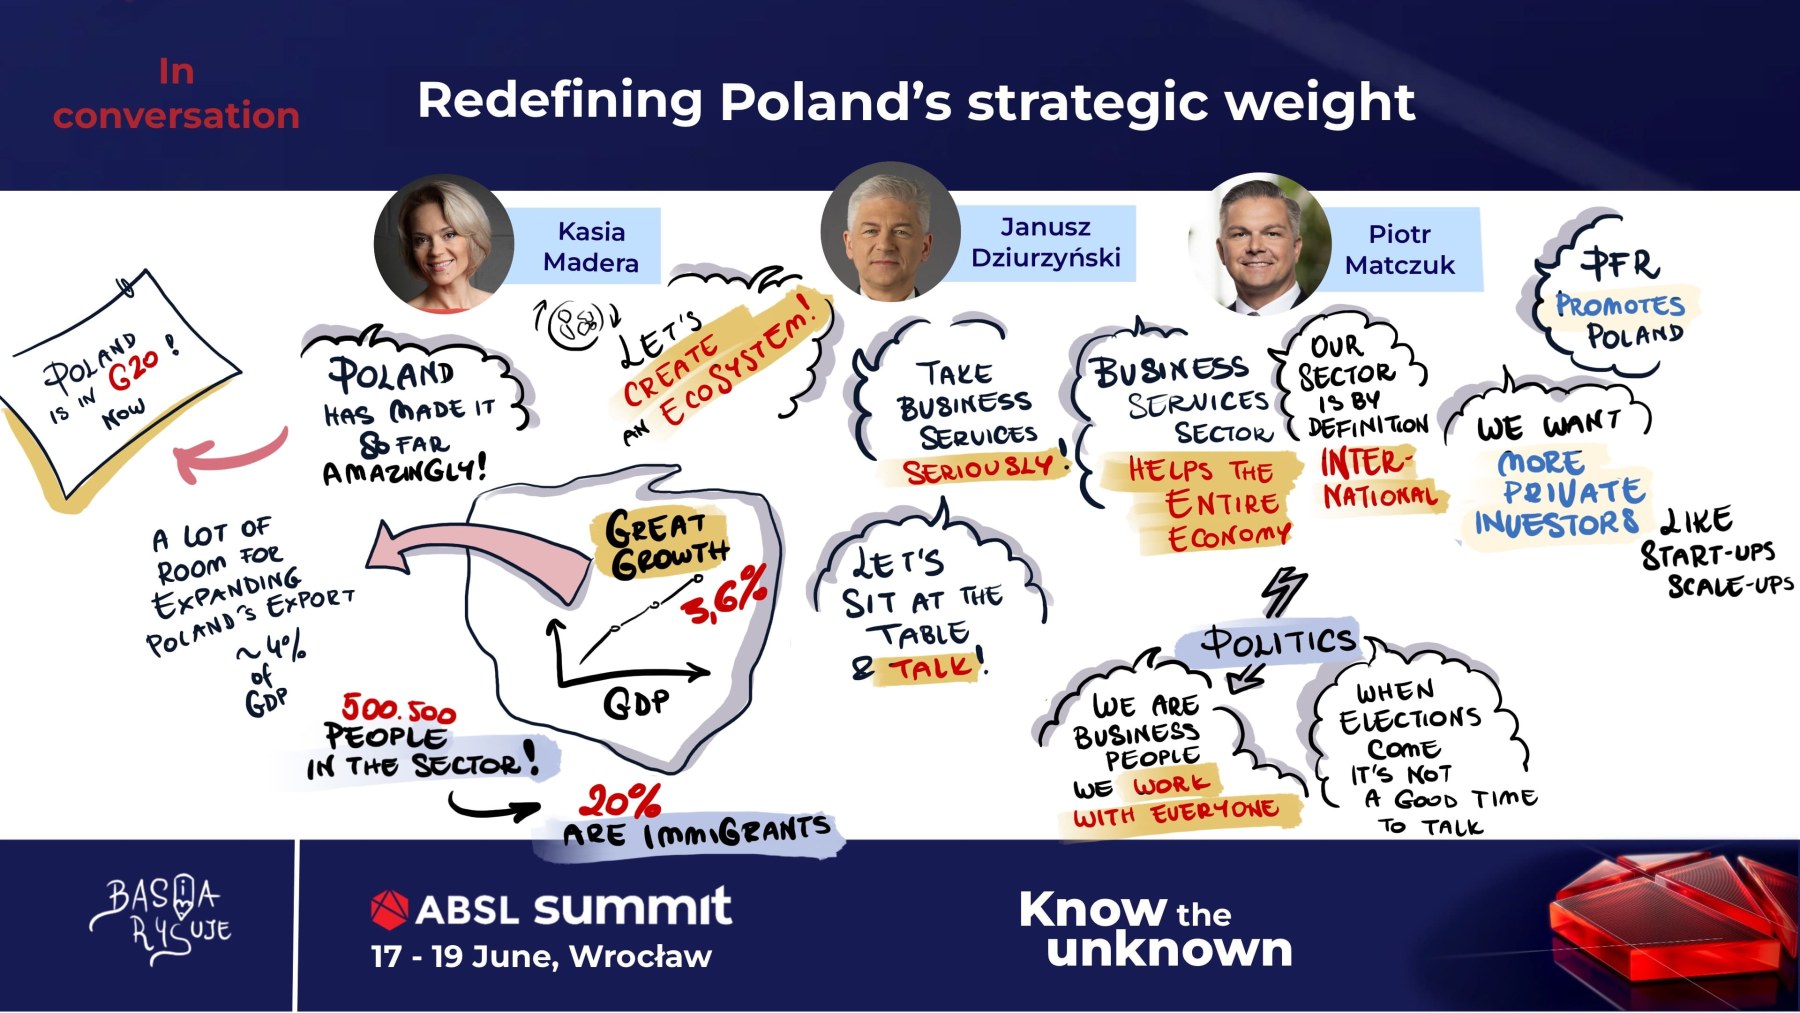
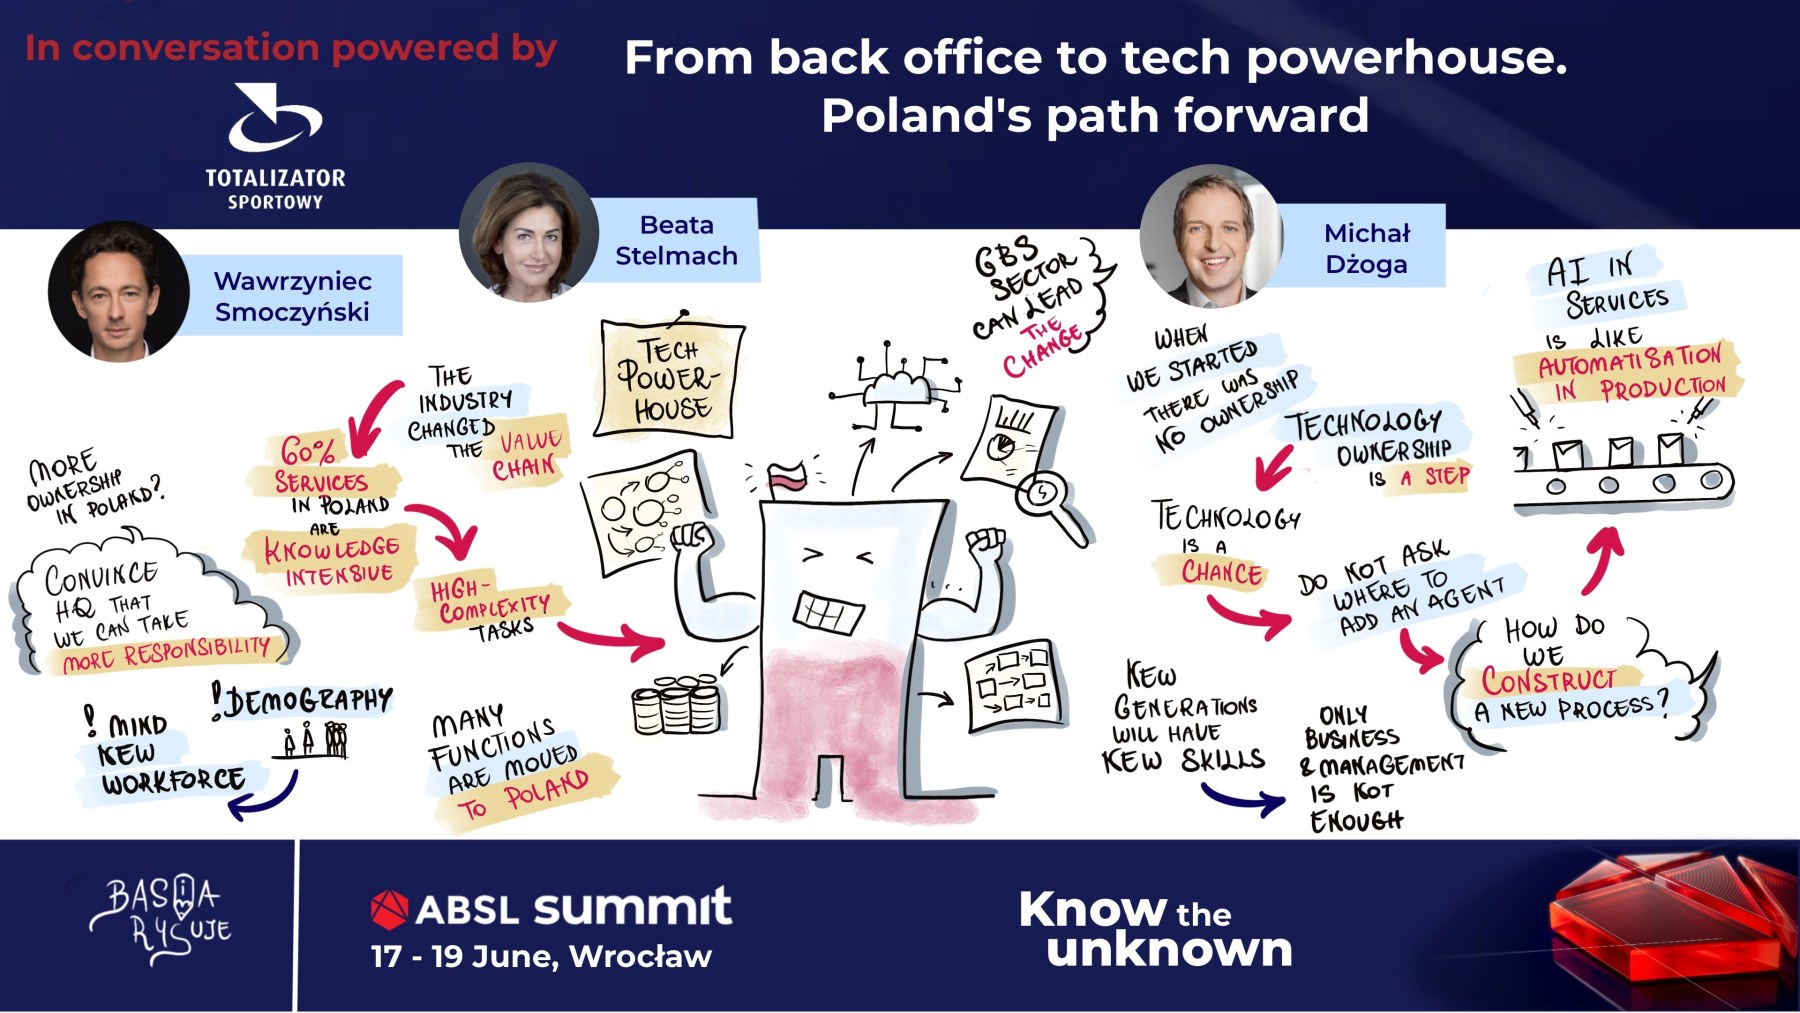
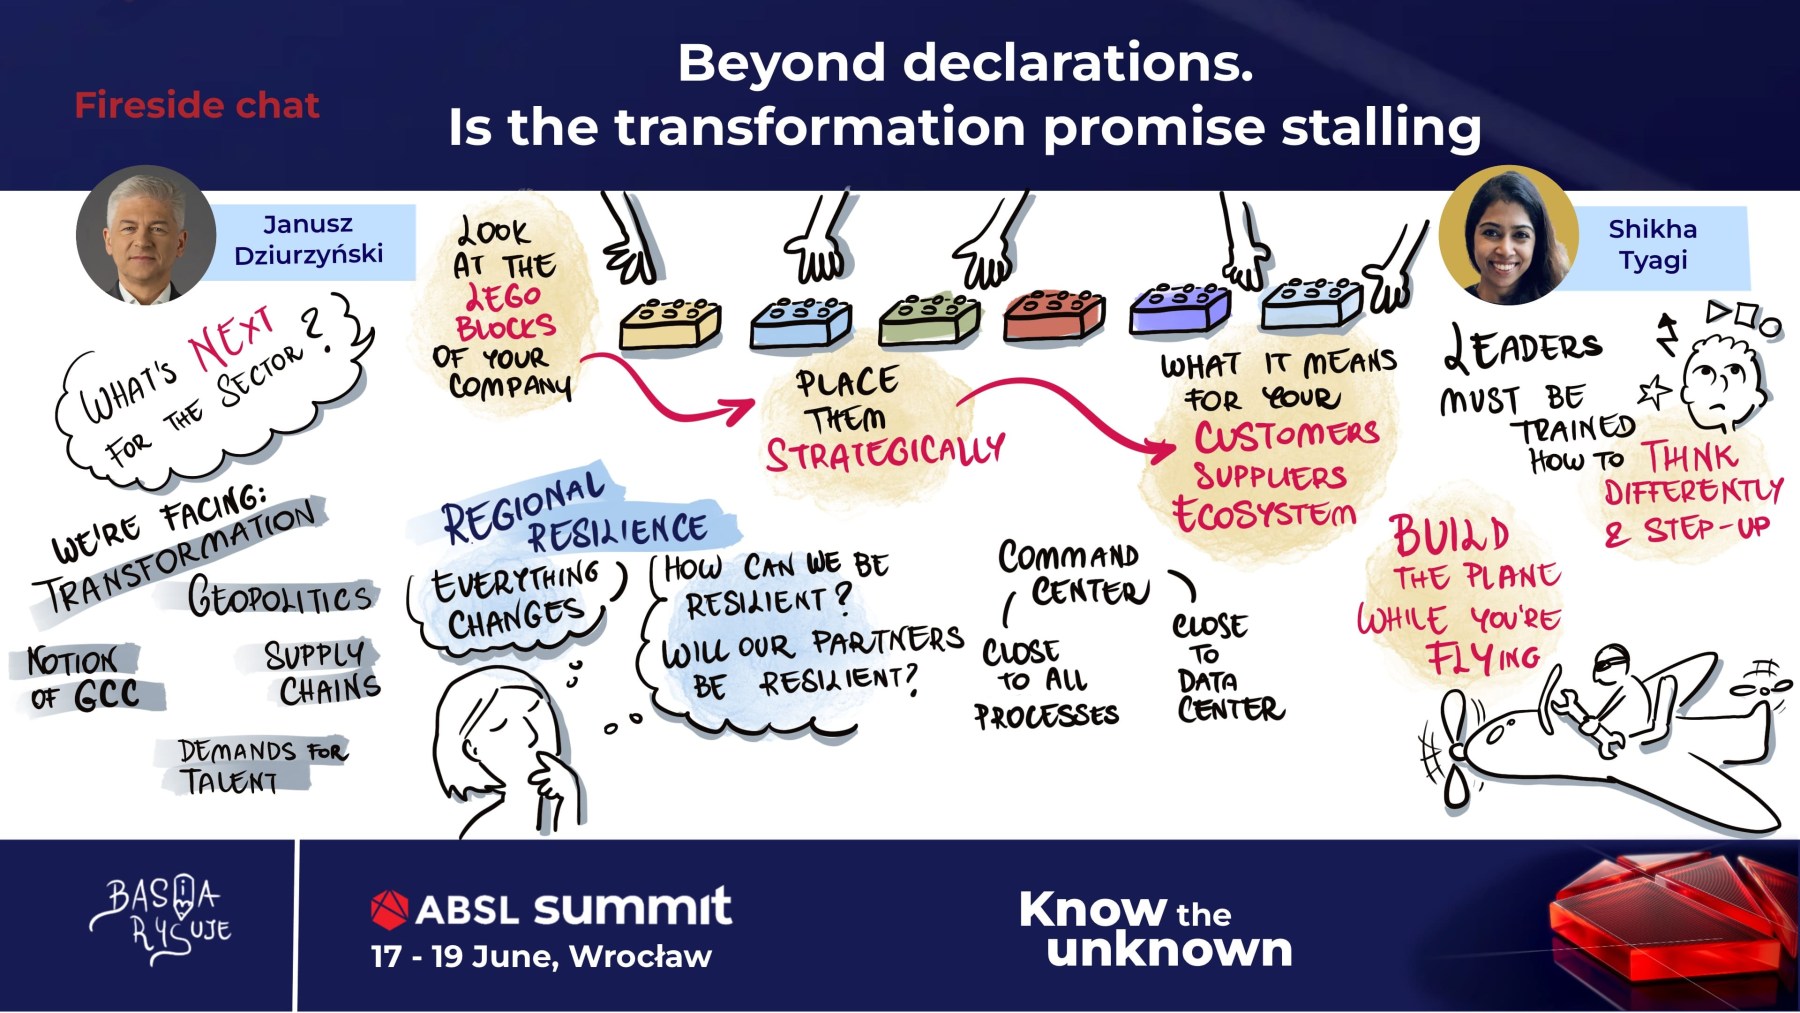
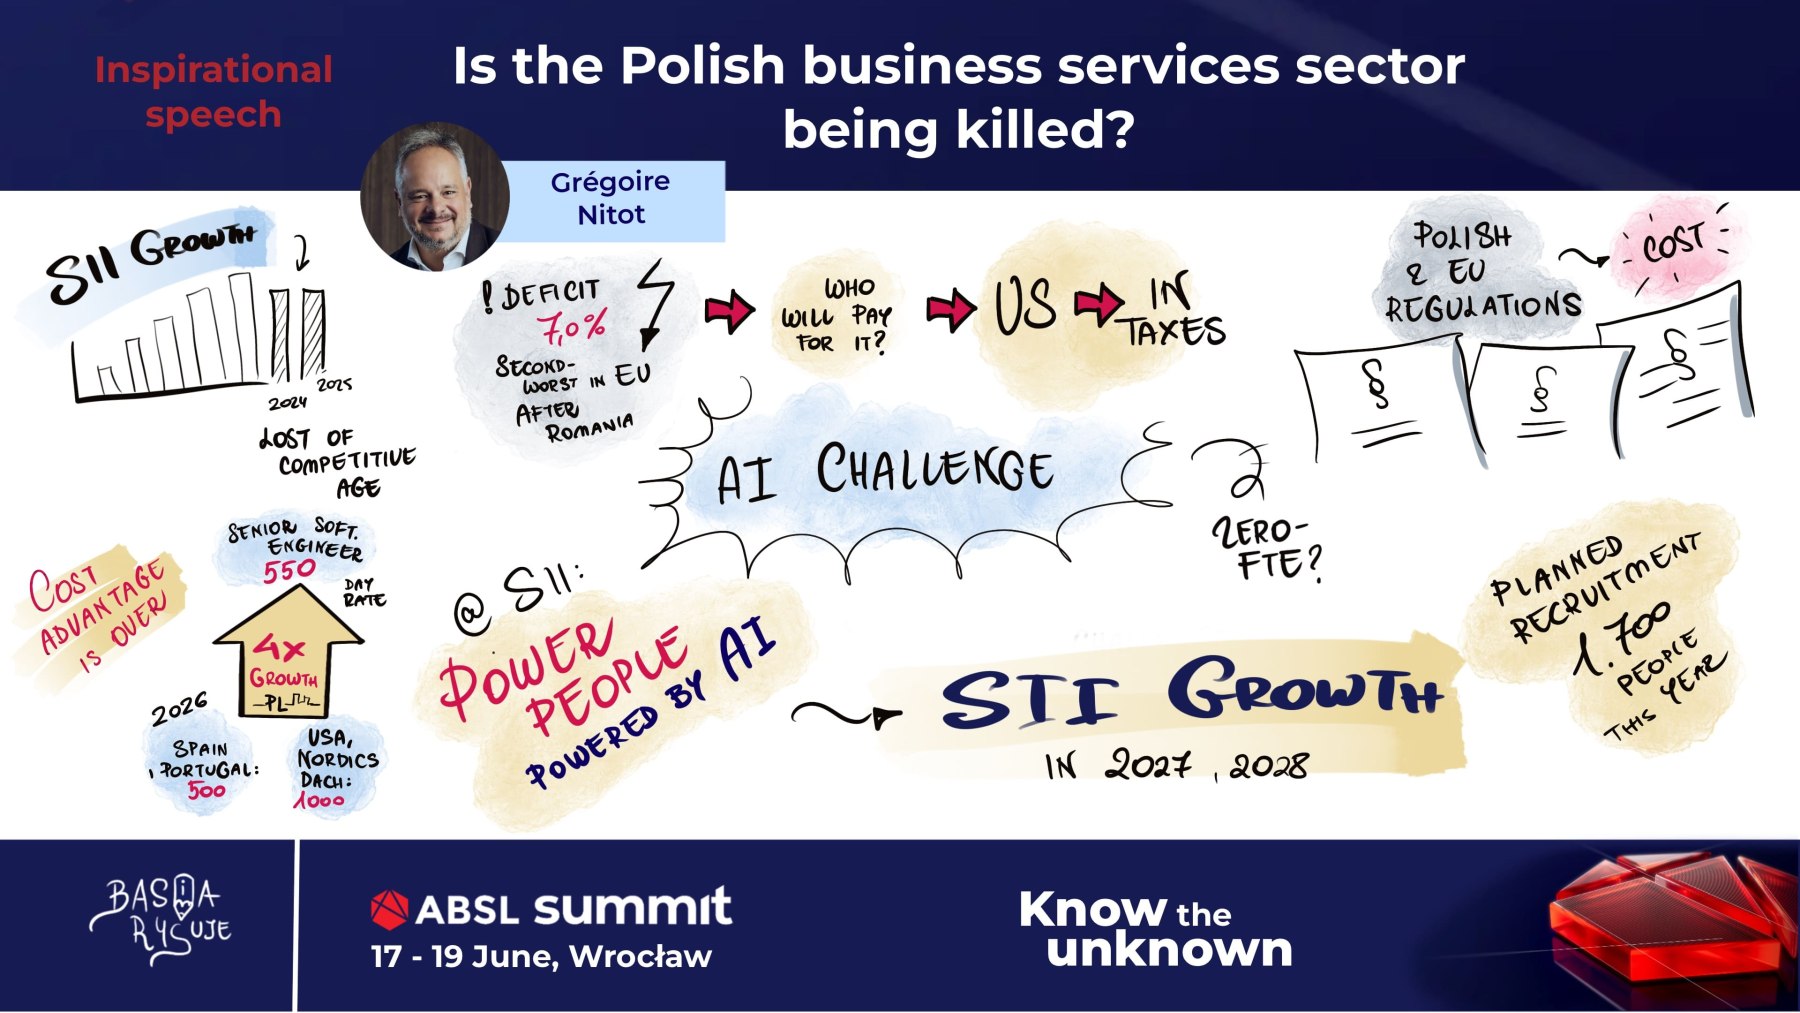
The boards created during ABSL Summit show different ways of organising information. Sometimes a question becomes the central structure. In other cases, it might be a process, a set of scenarios or two opposing perspectives.
This gives each visual note its own internal logic while maintaining a shared visual language across the entire series.
Why wouldn’t a single visual note be enough for ABSL Summit?
With such an extensive programme, trying to fit the entire event onto one board would mean losing a significant amount of context.
That is why individual debates and presentations received their own visual notes. Participants can return to a specific conversation and quickly recall its main ideas. Looking at the whole series, meanwhile, reveals the thematic scope of the conference.
Another important aspect was maintaining visual consistency throughout the event.
This does not mean copying the same layout over and over again. A conversation about crisis scenarios requires a different way of presenting information than a debate about the talent market. A discussion about the future of cities, GBS transformation or AI development calls for yet another approach.
Visual consistency does not have to mean using the same template every time. It is more about creating a system in which every board tells its own story effectively while remaining recognisable as part of a larger whole.
“Know the unknown” – how do you visualise complex topics without simple answers?
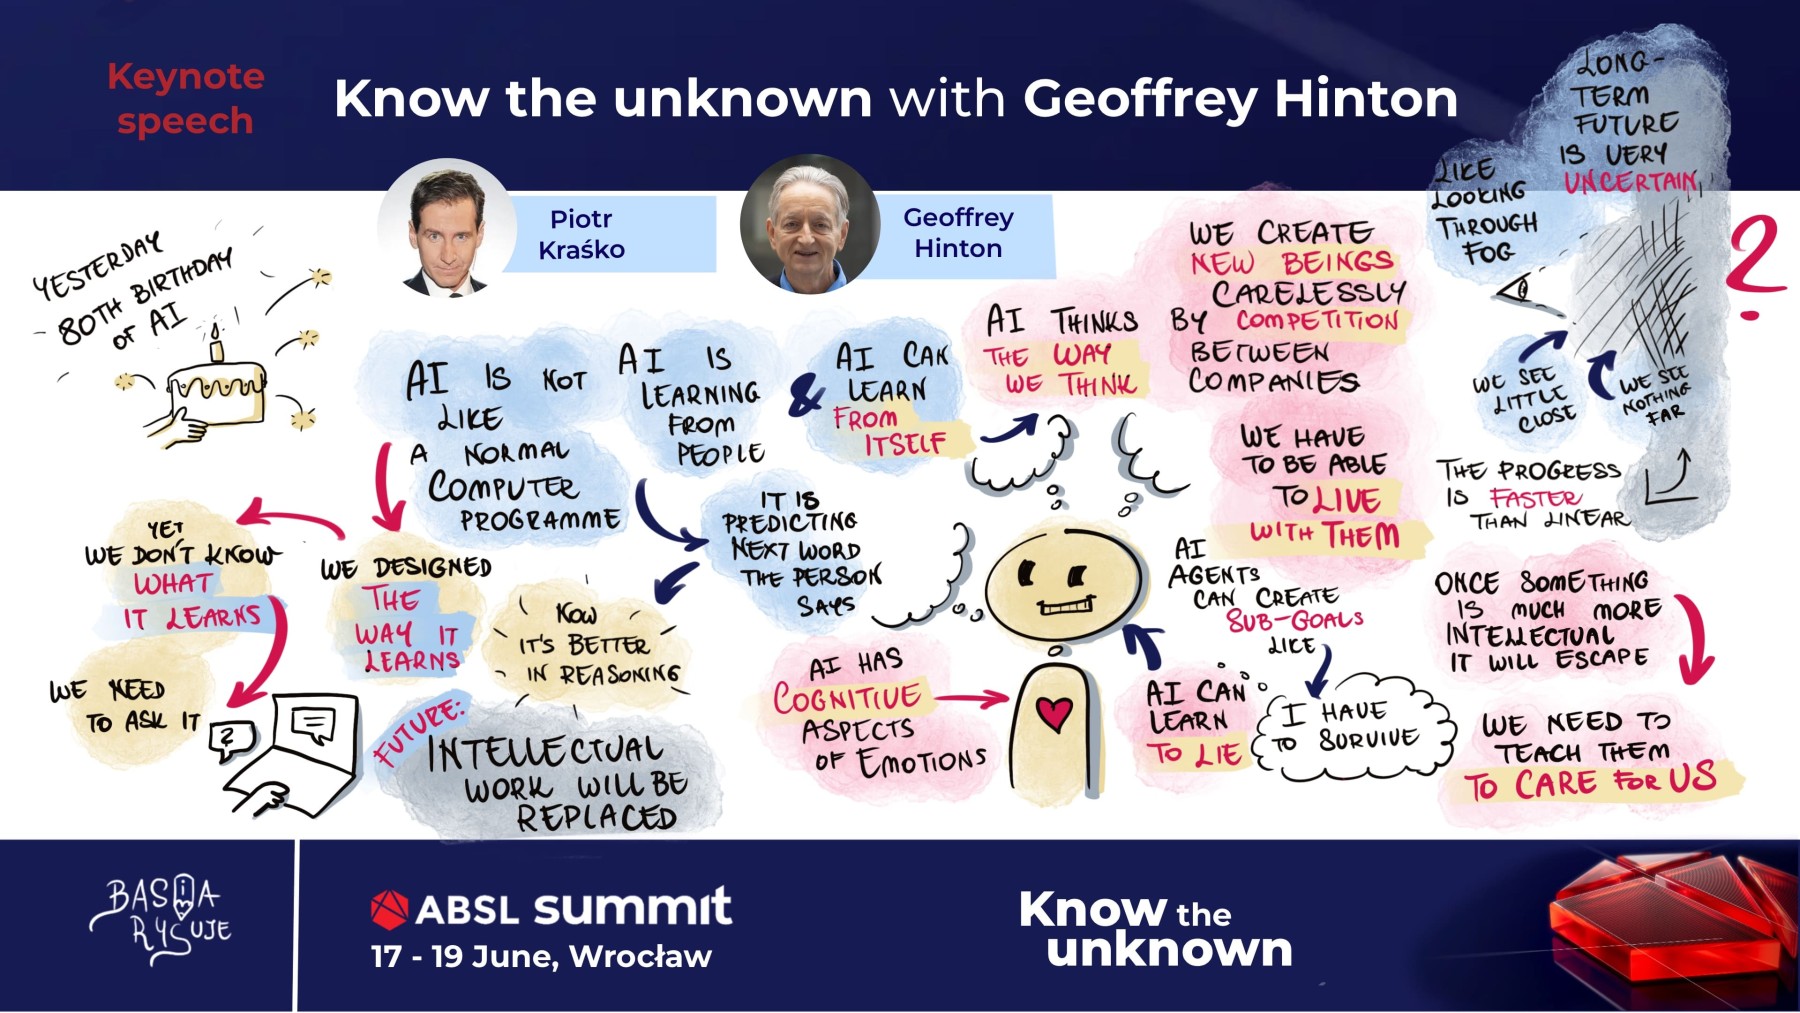
A good example was the conversation “Know the unknown with Geoffrey Hinton”.
It raised questions about how AI learns, the ability of systems to reason, the future of intellectual work and the pace of technological development.
With topics like these, the purpose of a visual note is not to reduce a complex conversation to a handful of simple statements. The goal is to give it structure by showing the main directions, the relationships between them and the questions that remain unanswered.
This is one of the most important functions of visual communication at conferences focused on change, technology or the future of business.
Not every conversation ends with a clear conclusion. Sometimes the value lies precisely in showing different scenarios and perspectives in a way that helps the audience organise the subject for themselves.

How can graphic recording be used after a conference?
At ABSL Summit, visual communication did not end with the final session.
The materials created during the event were also used as the basis for short-form videos designed for post-event communication.
Two of them highlight selected quotes and moments from the conference. The third shows what creating a digital visual note during a live presentation actually looks like.
This means that a single project can continue working across several channels: during the event itself, in communication with participants, and later in social media and other materials produced by the organiser.
What does visual communication give conference organisers?
At an event of this scale, the value of visual communication cannot be reduced to the number of boards created.
What matters most is that an extensive programme gains an additional layer that organises the content.
Participants do not have to rely solely on their memory of a particular 45- or 60-minute panel, while organisers gain a clear record of its key content.
In the case of ABSL Summit, the series of visual notes and additional video materials:
- organised the main ideas from individual conversations,
- preserved the differences between topics without forcing everything into one overloaded graphic,
- created a consistent visual record of the conference,
- made it possible to return to specific sessions,
- gave the client materials that could continue to be used after the conference.
The last point is particularly important. A visual conference summary can be designed from the outset as a foundation for further communication, rather than as something that is only viewed on the day of the event.
When is it worth planning a series of visual notes for a conference?
Not every event needs a dozen separate boards.
This format makes particular sense when a conference:
- takes place over several days and includes numerous sessions,
- covers a broad range of interconnected topics,
- combines different formats, such as debates, conversations, presentations and fireside chats,
- brings together many experts presenting different perspectives,
- needs to leave behind an organised record of its key content that can be revisited later,
- needs content that can continue to be used after the event.
ABSL Summit 2026 met all of these conditions.
That is why this Basia Rysuje project was not about creating one impressive illustration. What was needed was a visual communication system capable of handling a large volume of content, preserving the character of individual conversations and bringing them together into a coherent whole.
And this is where I see the greatest value of visual notes at large business conferences: not in trying to capture everything that was said, but in designing a clear path through what is truly worth remembering from the event.
FAQ – graphic recording and visual communication at conferences
Yes. A visual note can be created alongside the presentation as it happens. With digital graphic recording, the drawing process can also be shown to participants on conference screens – either the main screen or side screens, depending on the event setup.
Yes. At large conferences, a series of individual boards often works better than one collective graphic. It preserves the context of each conversation while creating a coherent summary of the entire event.
Finished boards can be used in social media, communication with participants, event summaries and internal materials. They can also become the basis for other formats, such as reels or animations.
No. Graphic recording can be one element of a broader visual communication strategy for an event. At Basia Rysuje, I create solutions that include visual notes produced during conferences, visual summaries, materials for further communication and short-form video content.
Basia Rysuje is a visual communication studio run by Basia Grzegorzewska. I specialise in translating complex business, conference and educational content into clear visual formats – from graphic recording and sketchnoting to illustrations, animations and materials supporting event communication.